Honeycomb was built for the AI era. Learn how to futureproof your software for what comes next.
Discover why Honeycomb is the better choice for your engineers, your customers, and your bottom line.
Start your journey with the definitive guide to observability. Download our complimentary ebook.
Bring observability to every software engineer.
Learn about our company, mission and values.
Come for the impact, stay for the culture.
See Honeycomb's latest press releases, media, and more
Learn more about becoming a Honeycomb partner.
Already a Honeycomb customer?
Jessica Kerr (Jessitron)
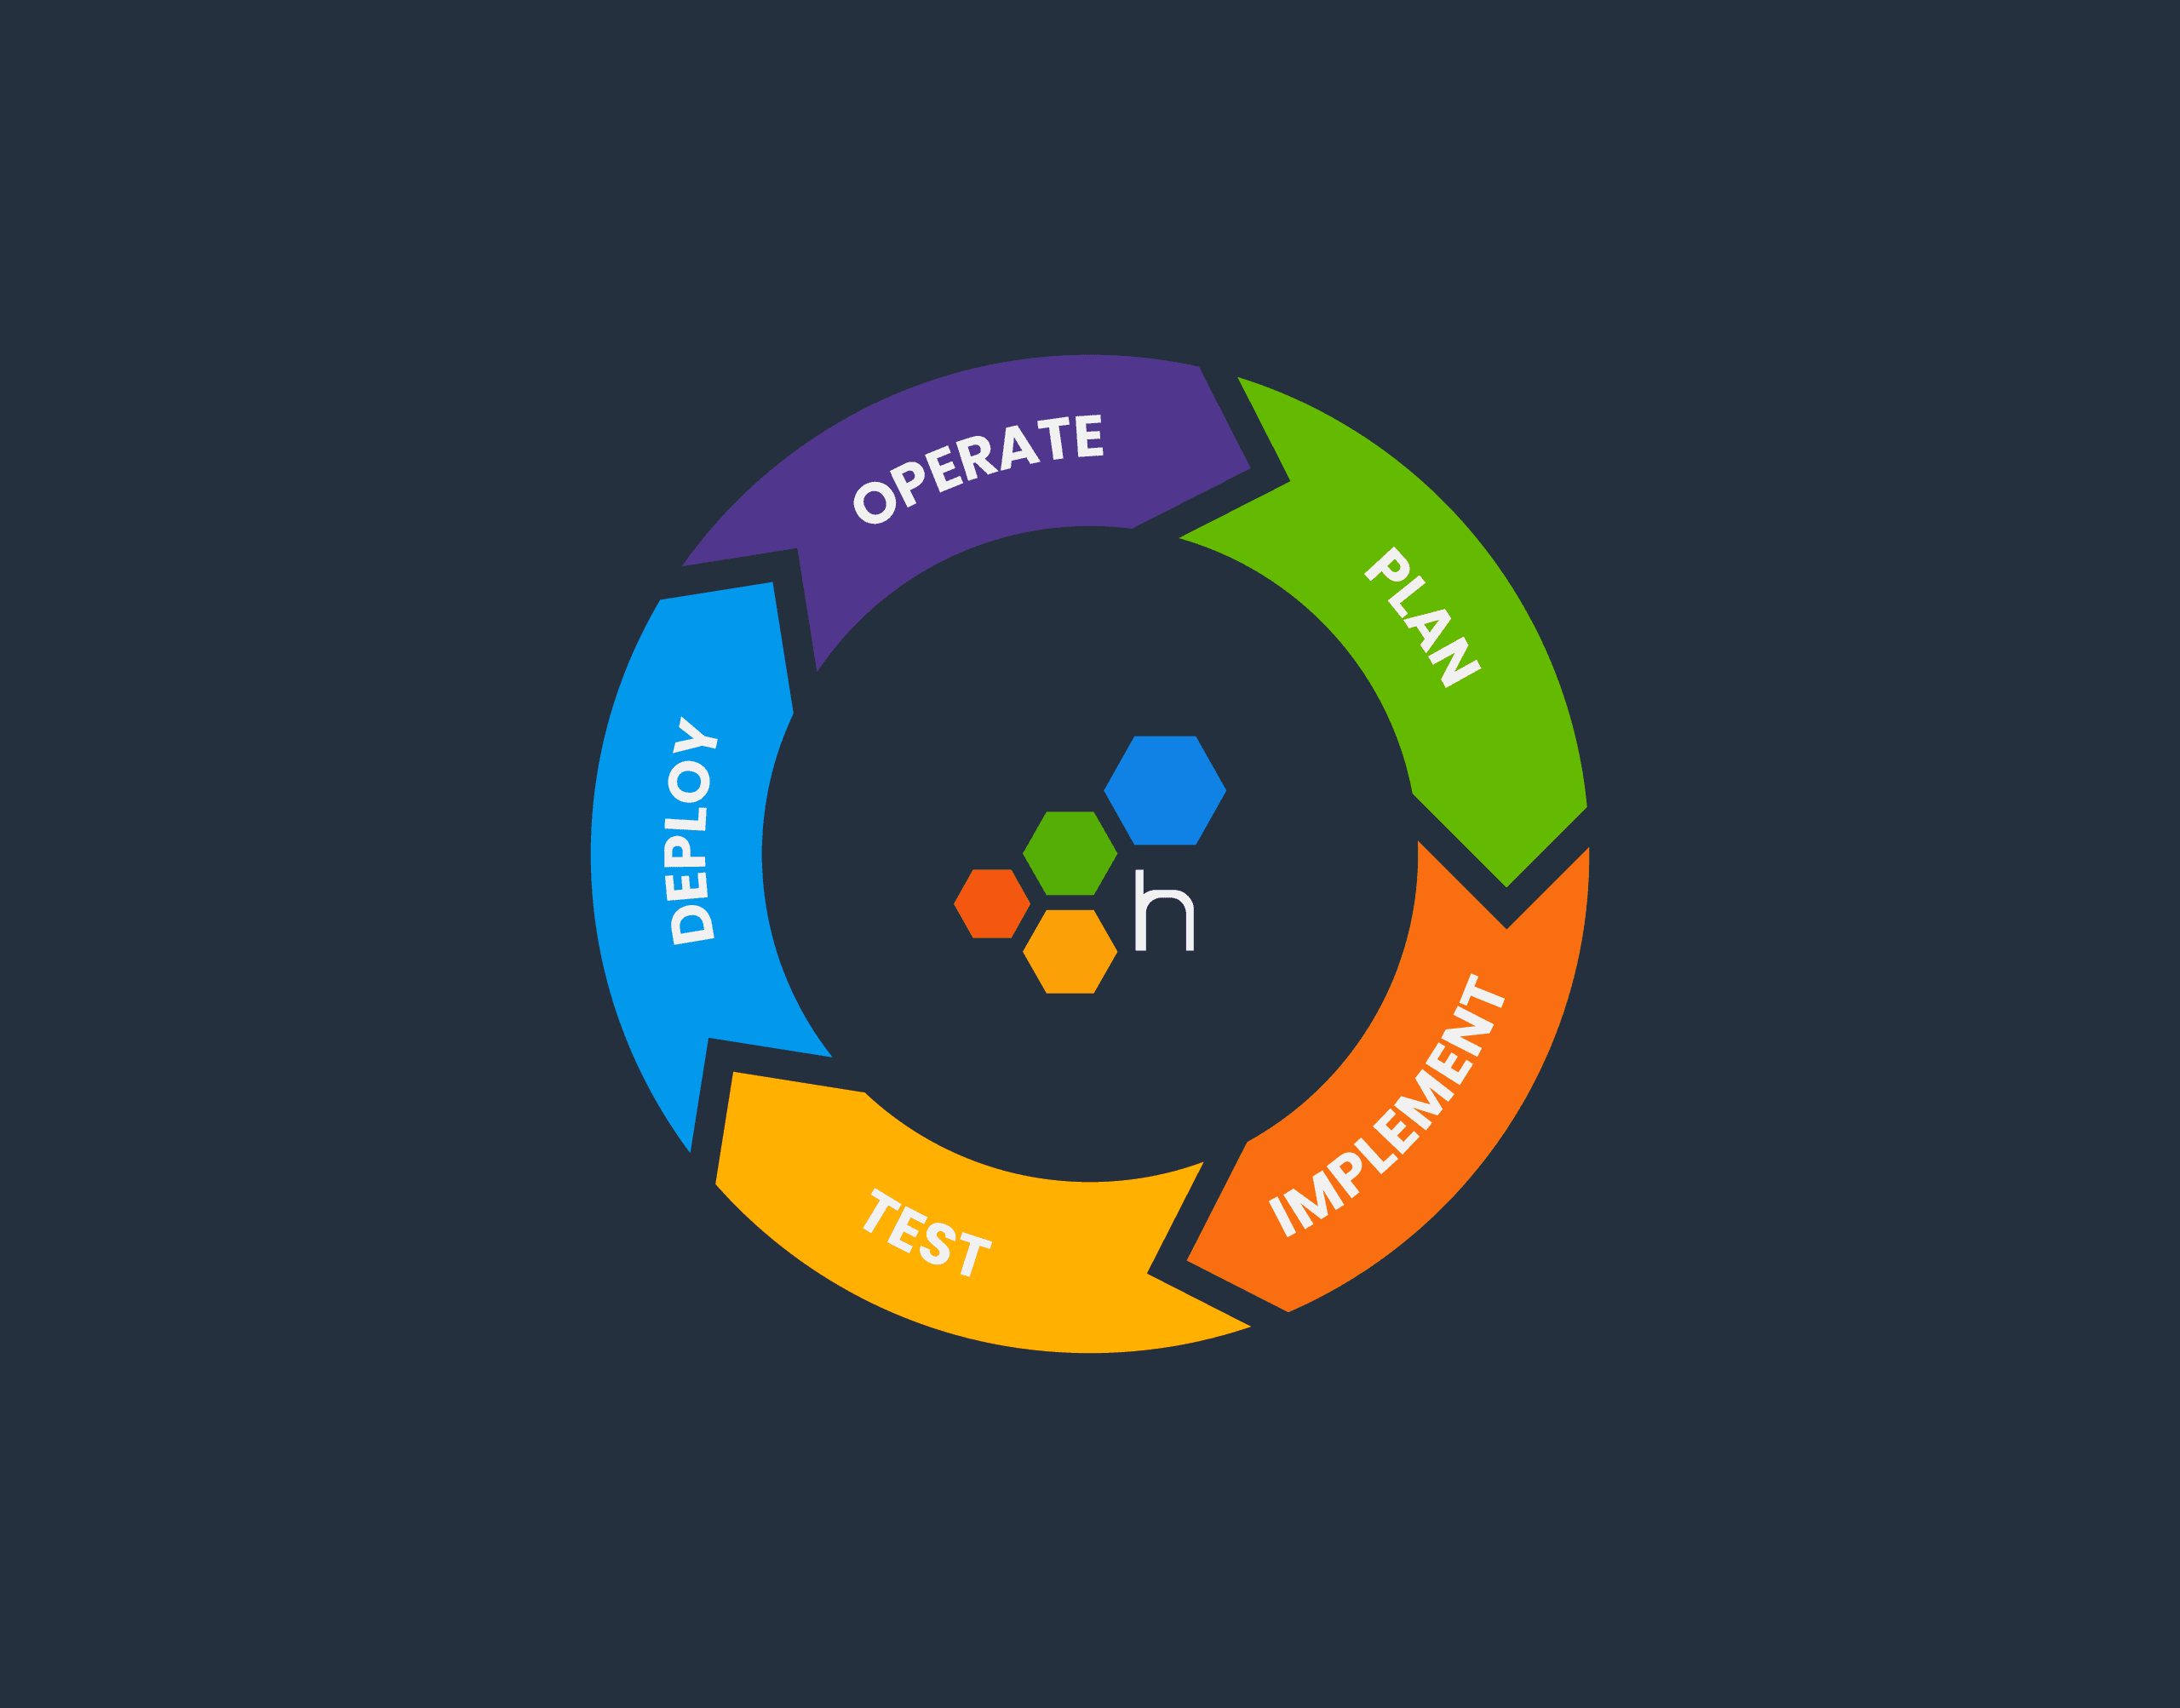
The software development lifecycle (SDLC) is always drawn as a circle. In many places I’ve worked, there’s no discernable connection between “5. Operate” and “1. Plan.” However, at Honeycomb, there is.
Charity Majors
The cost of services is on everybody’s mind right now, with interest rates rising, economic growth slowing, and organizational budgets increasingly feeling the pinch. But I hear a special edge in people’s voices when it comes to their observability bill, and I don’t think it’s just about the cost of goods sold. I think it’s because people are beginning to correctly intuit that the value they get out of their tooling has become radically decoupled from the price they are paying.
Fahim Zaman
For developers, understanding the performance of shipped code is crucial. Through the last decade, a tablestake function in software monitoring and observability solutions has been to save and track app metrics. Engineers love tools that get out of your way and just work, and the appeal of today’s best-in-class application performance monitoring (APM) suites lies in a seamless day zero experience with drop-in agent installs, button click integrations, and immediate metrics collection. However, the success of no-hassle metrics comes with a caveat—the internet is replete with examples of premiere application monitoring costs spiraling beyond expectations.
Jamie Danielson
Observability is important to understand what’s happening in production. But carving out the time to add instrumentation to a codebase is daunting, and often treated as a separate task to writing features. This means that we end up instrumenting for observability long after a feature has shipped, usually when there’s a problem with it and we’ve lost all context. What if we instead treated observability similarly to how we treat tests? We don’t submit code without a test, so let’s do the same with observability: treat it as part of the feature while the code is still fresh in our mind, with the benefit of being able to observe how the feature behaves in production.
Phillip Carter
Like many companies, earlier this year we saw an opportunity with LLMs and quickly (but thoughtfully) started building a capability. About a month later, we released Query Assistant to all customers as an experimental feature. We then iterated on it, using data from production to inform a multitude of additional enhancements, and ultimately took Query Assistant out of experimentation and turned it into a core product offering. However, getting Query Assistant from concept to feature diverted R&D and marketing resources, forcing the question: did investing in LLMs do what we wanted it to do?
Many software engineers are encountering LLMs for the very first time, while many ML engineers are being exposed directly to production systems for the very first time. Both types of engineers are finding themselves plunged into a disorienting new world—one where a particular flavor of production problem they may have encountered occasionally in their careers is now front and center.
Adnan Rahić
Our friends at Tracetest recently released an integration with Honeycomb that allows you to build end-to-end and integration tests, powered by your existing distributed traces. You only need to point Tracetest to your existing trace data source—in this case, Honeycomb. This guest blog post from Adnan Rahić walks you through how the integration works.
The Accelerate State of Devops Report highlights four key metrics (known as the DORA metrics, for DevOps Research & Assessment) that distinguish high-performing software organizations: deployment frequency, lead time for changes, time-to-restore1, and change…
Purvi Kanal
Each CWV measures a specific part of the end user experience. CWV scores can help identify gaps in web page performance. Additionally, Google uses CWV scores as one of the measures it uses to rank pages, which means they are important for SEO.
Roel Vista
n technical support, ensuring customer satisfaction and quickly resolving issues are of utmost importance. At Honeycomb, we embrace a comprehensive approach by using our own platform—not only for engineering purposes, but to also empower our support team.
Kyle Moonwright
Insightful proof-of-concepts with a tool can be difficult to undertake due to the demands on valuable resources: time, energy, and people. With a task as grand as observability, how could one truly test if Honeycomb and OpenTelemetry are right for their organization and meet their requirements? For this thought experiment, here’s a comprehensive description of the ideal product evaluation over the course of four weeks, given unlimited resources.
At Honeycomb, we are all about observability. In the past, we have proposed observability-driven development as a way to maximize your observability and supercharge your development process. But I have a problem with the terminology, and it is: I don’t want observability to drive your development.
Get it delivered straight to your inbox.
By subscribing to our newsletter, you agree to Honeycomb’s Terms of Service and Privacy Notice.
Martin Thwaites
We saw a shift this year in how the technology sector honed in on sustainability from a cost perspective. In particular, looking at where they’re spending that revenue in the infrastructure and tooling space. Observability tooling comes under a lot of scrutiny as it’s perceived as a large cost center—and one that could be cut without affecting revenue. After all, if the business hasn’t had a problem in the last few months, we mustn’t need monitoring—right?
Nathan Lincoln
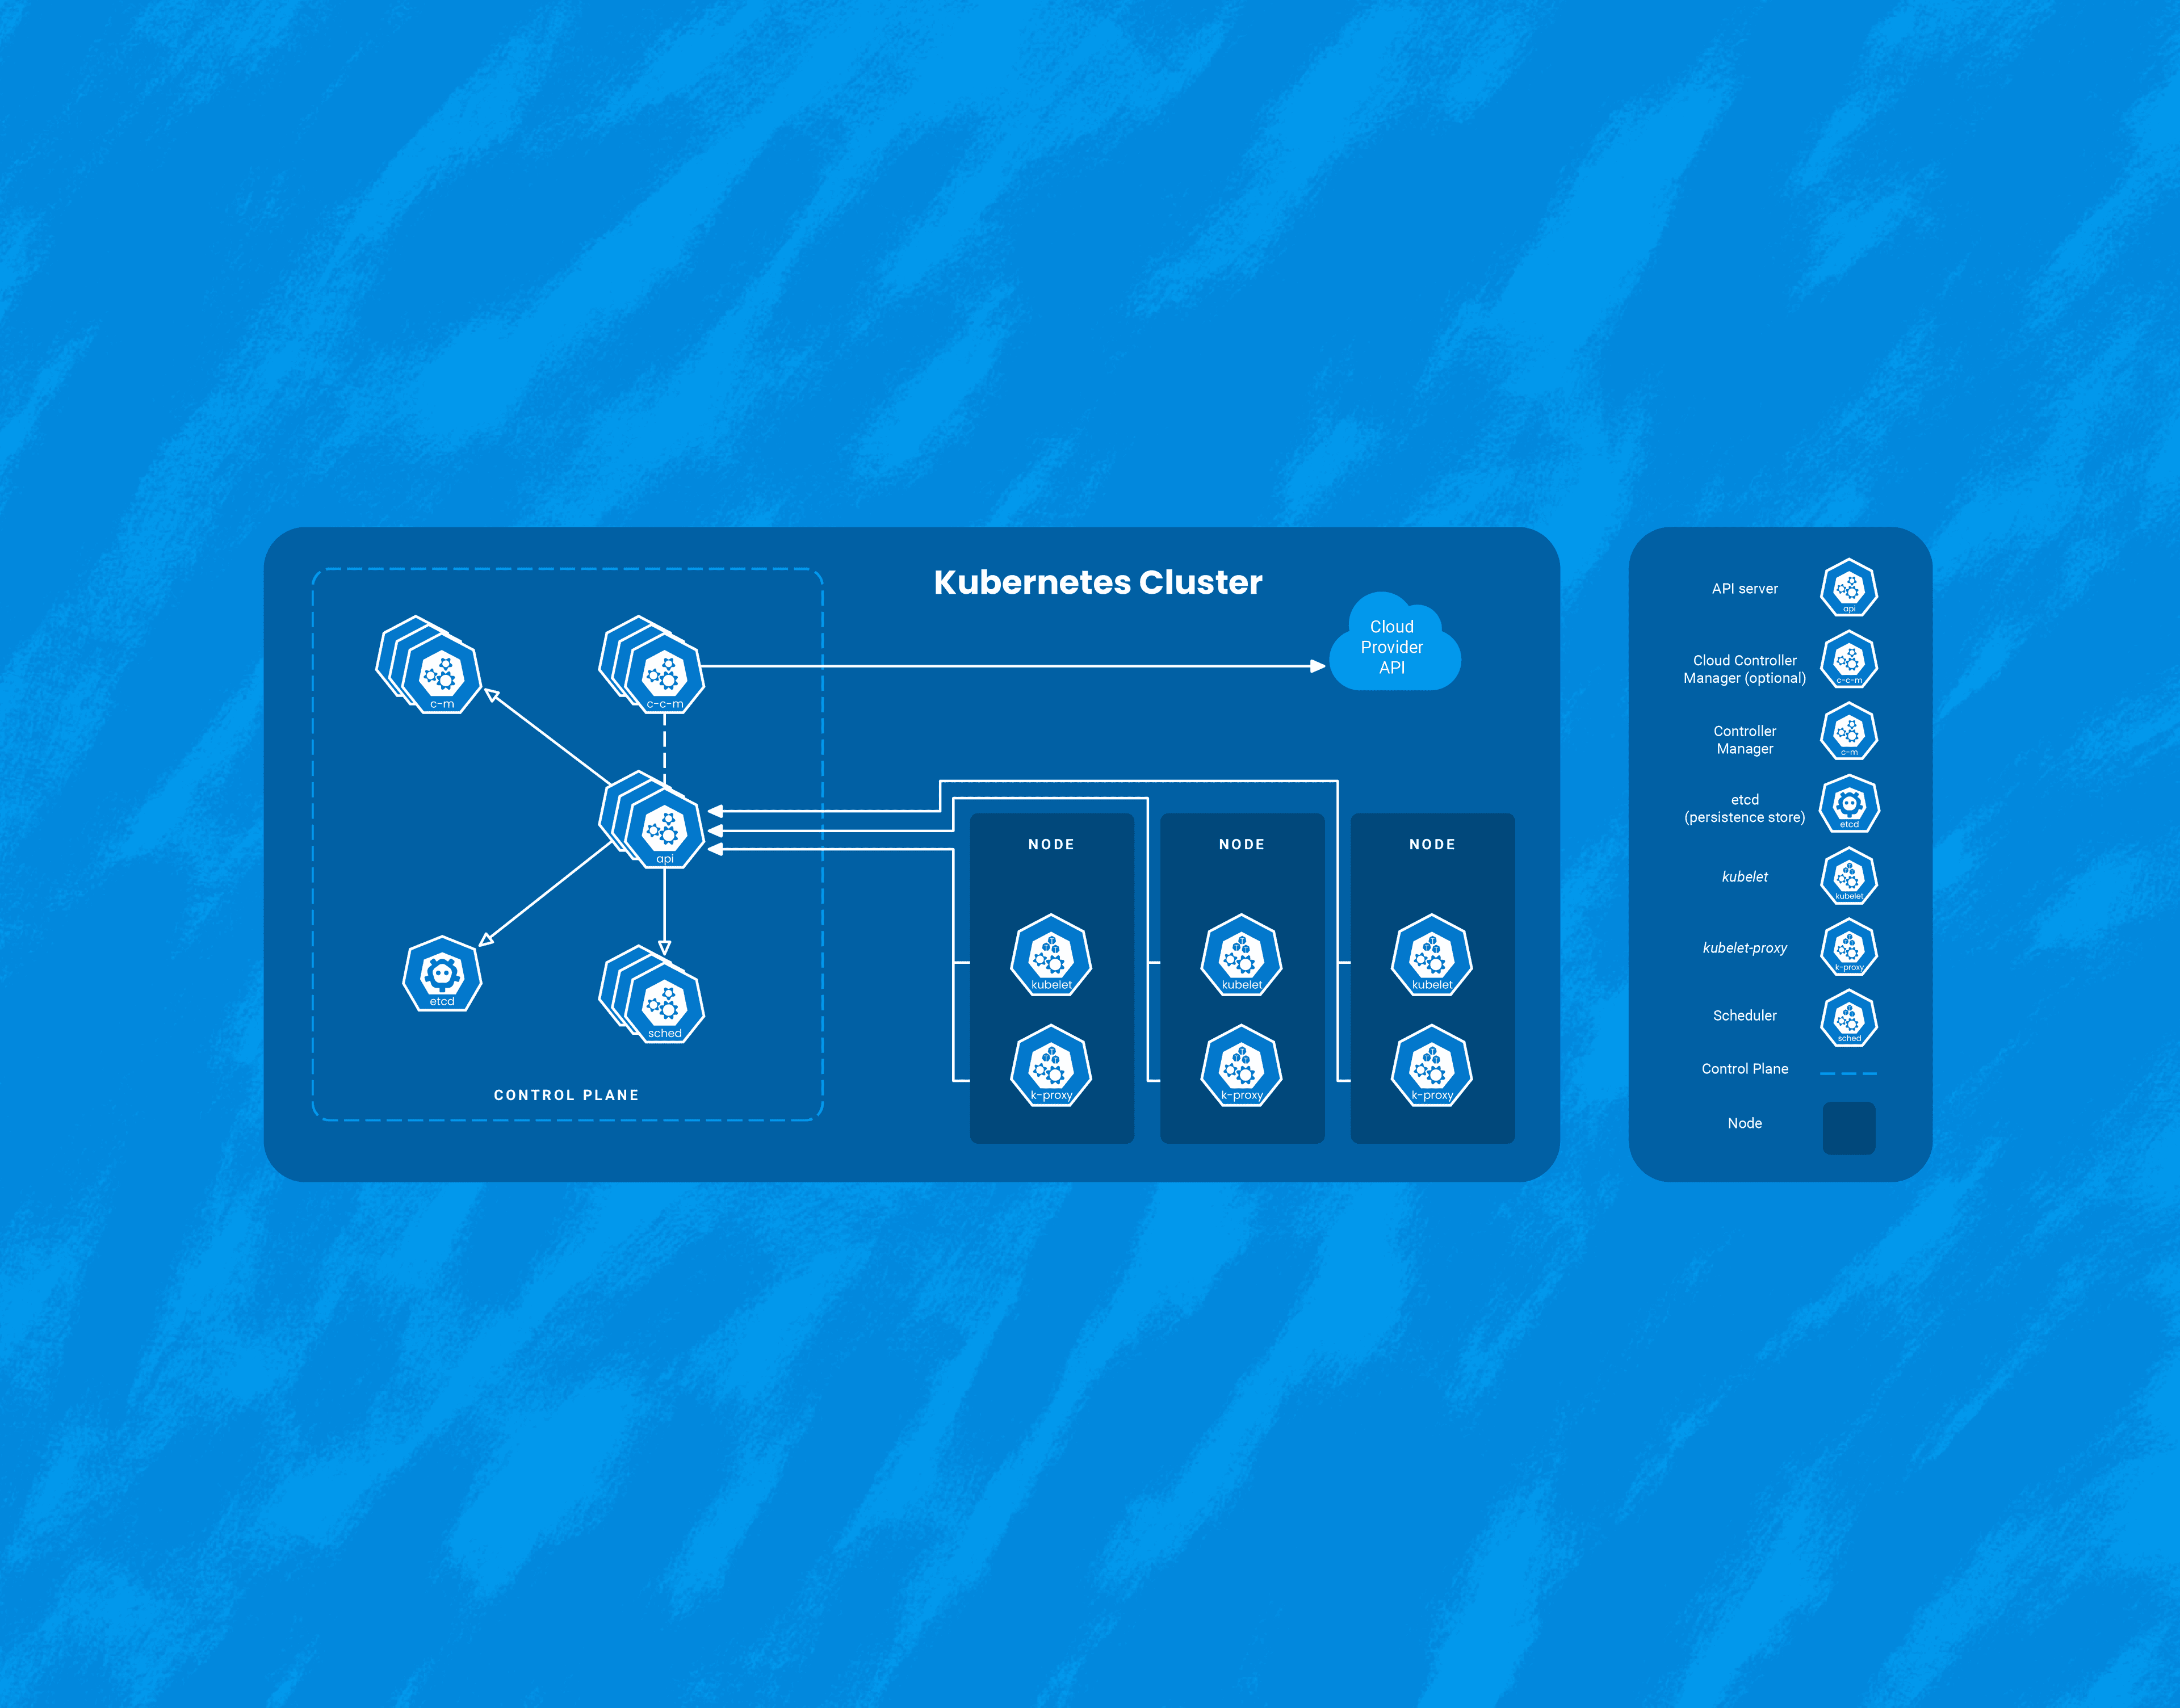
While Kubernetes comes with a number of benefits, it’s yet another piece of infrastructure that needs to be managed. Here, I’ll talk about three interesting ways that Honeycomb uses Honeycomb to get insight into our Kubernetes clusters. It’s worth calling out that we at Honeycomb use Amazon EKS to manage the control plane of our cluster, so this document will focus on monitoring Kubernetes as a consumer of a managed service.
Tyler Wilson
Frontend observability is a tricky problem. No website is free of errors or slowdowns; sites break down in weird ways for all kinds of reasons. Accounting for every possible combination of platform, browser, extensions, and (sometimes baffling) user behavior would be an impossible task. How do we decide which errors are important? One useful framework for making these frontend development decisions is customer-centric observability.
Rebecca Carter
Modern software development—where code is shipped fast and fixed quickly—simply can’t happen without building observability in before deployments happen. Teams need to see inside the code and CI/CD pipelines before anything ships, because finding problems early makes them easier to fix. And don’t take “easier to fix” lightly: incidents found late not only impact the customer experience (and perhaps their loyalty), but they also hit developer productivity and job satisfaction hard.
Rox Williams
Heatmaps are a beautiful thing. So are charts. Even better is that sometimes, they end up producing unintentional—or intentional, in the case of our happy o11ydays experiment—art.
The modern standard for observability in backend systems is: distributed traces with OpenTelemetry, plus dynamic aggregations over these events. This works very well in the world of web servers. But what about the web client?
Dear Miss O11y, I want to make my microservices more observable. Currently, I only have logs. I’ll add metrics soon, but I’m not really sure if there is a set path you follow. Is a guide of some sort, or best practice, like you have to have x kinds of metrics? I just want to know what all possibilities are out there. I am very new to this space.
Jessica McElroy
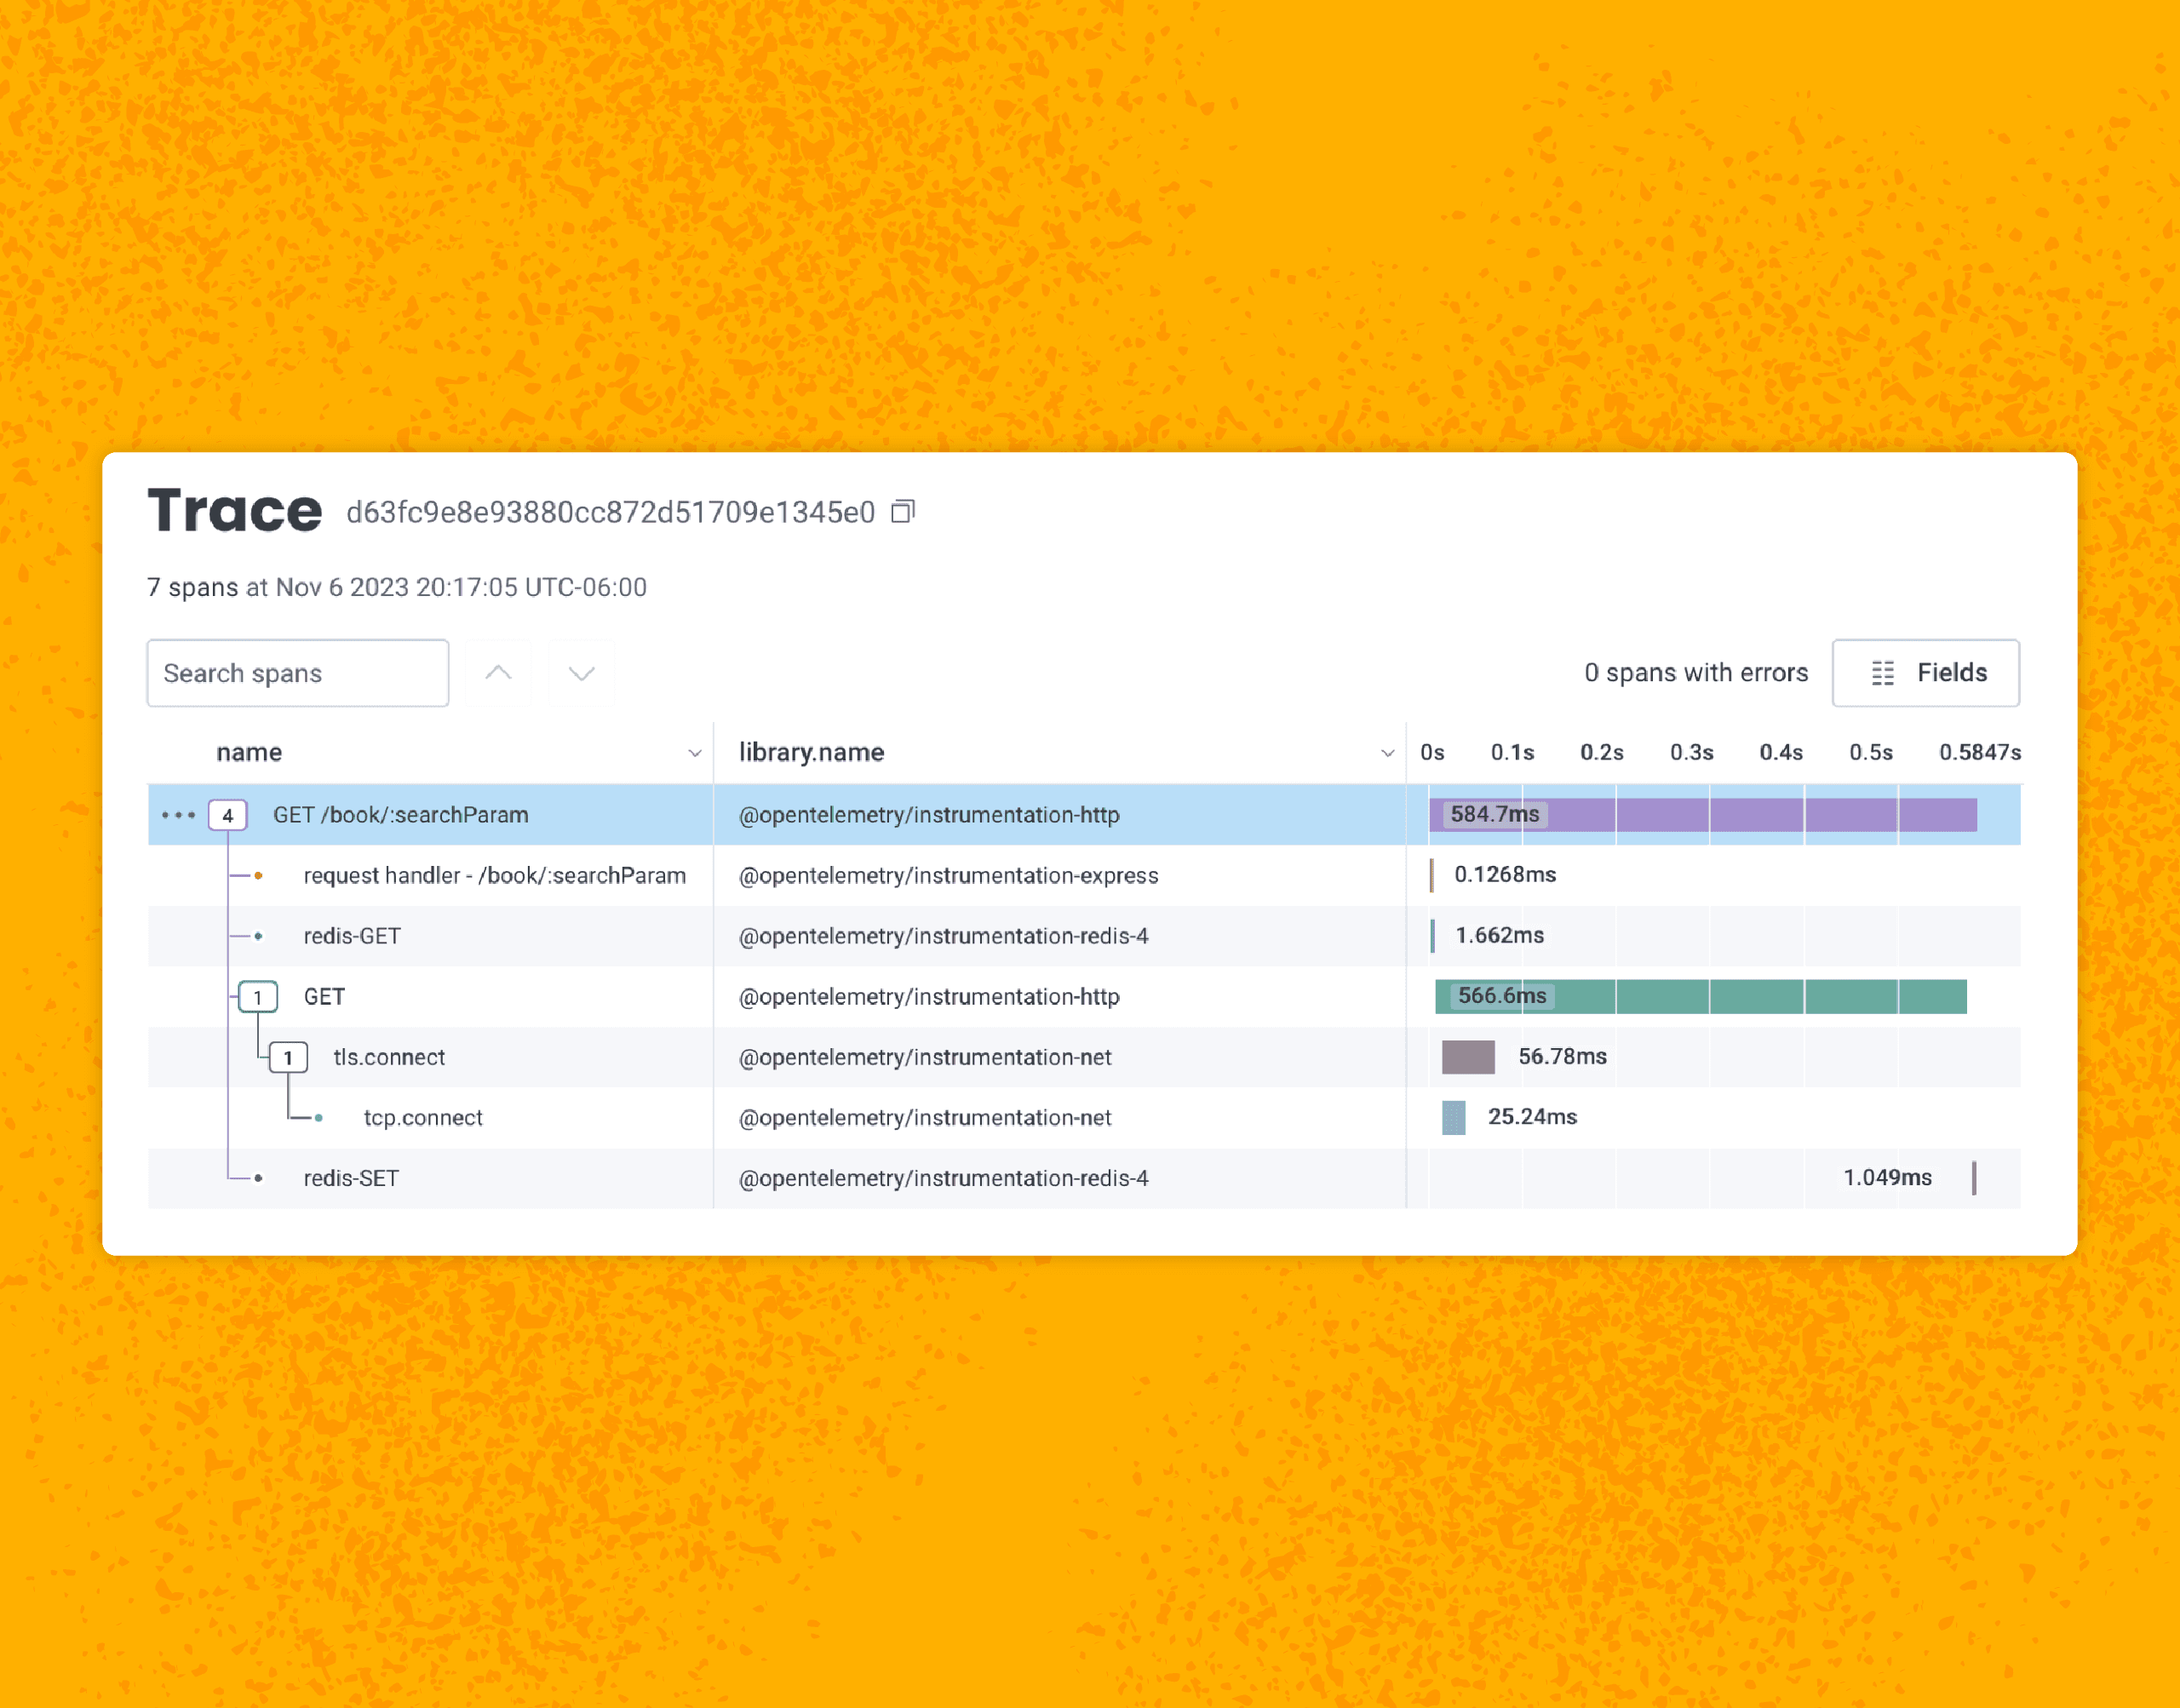
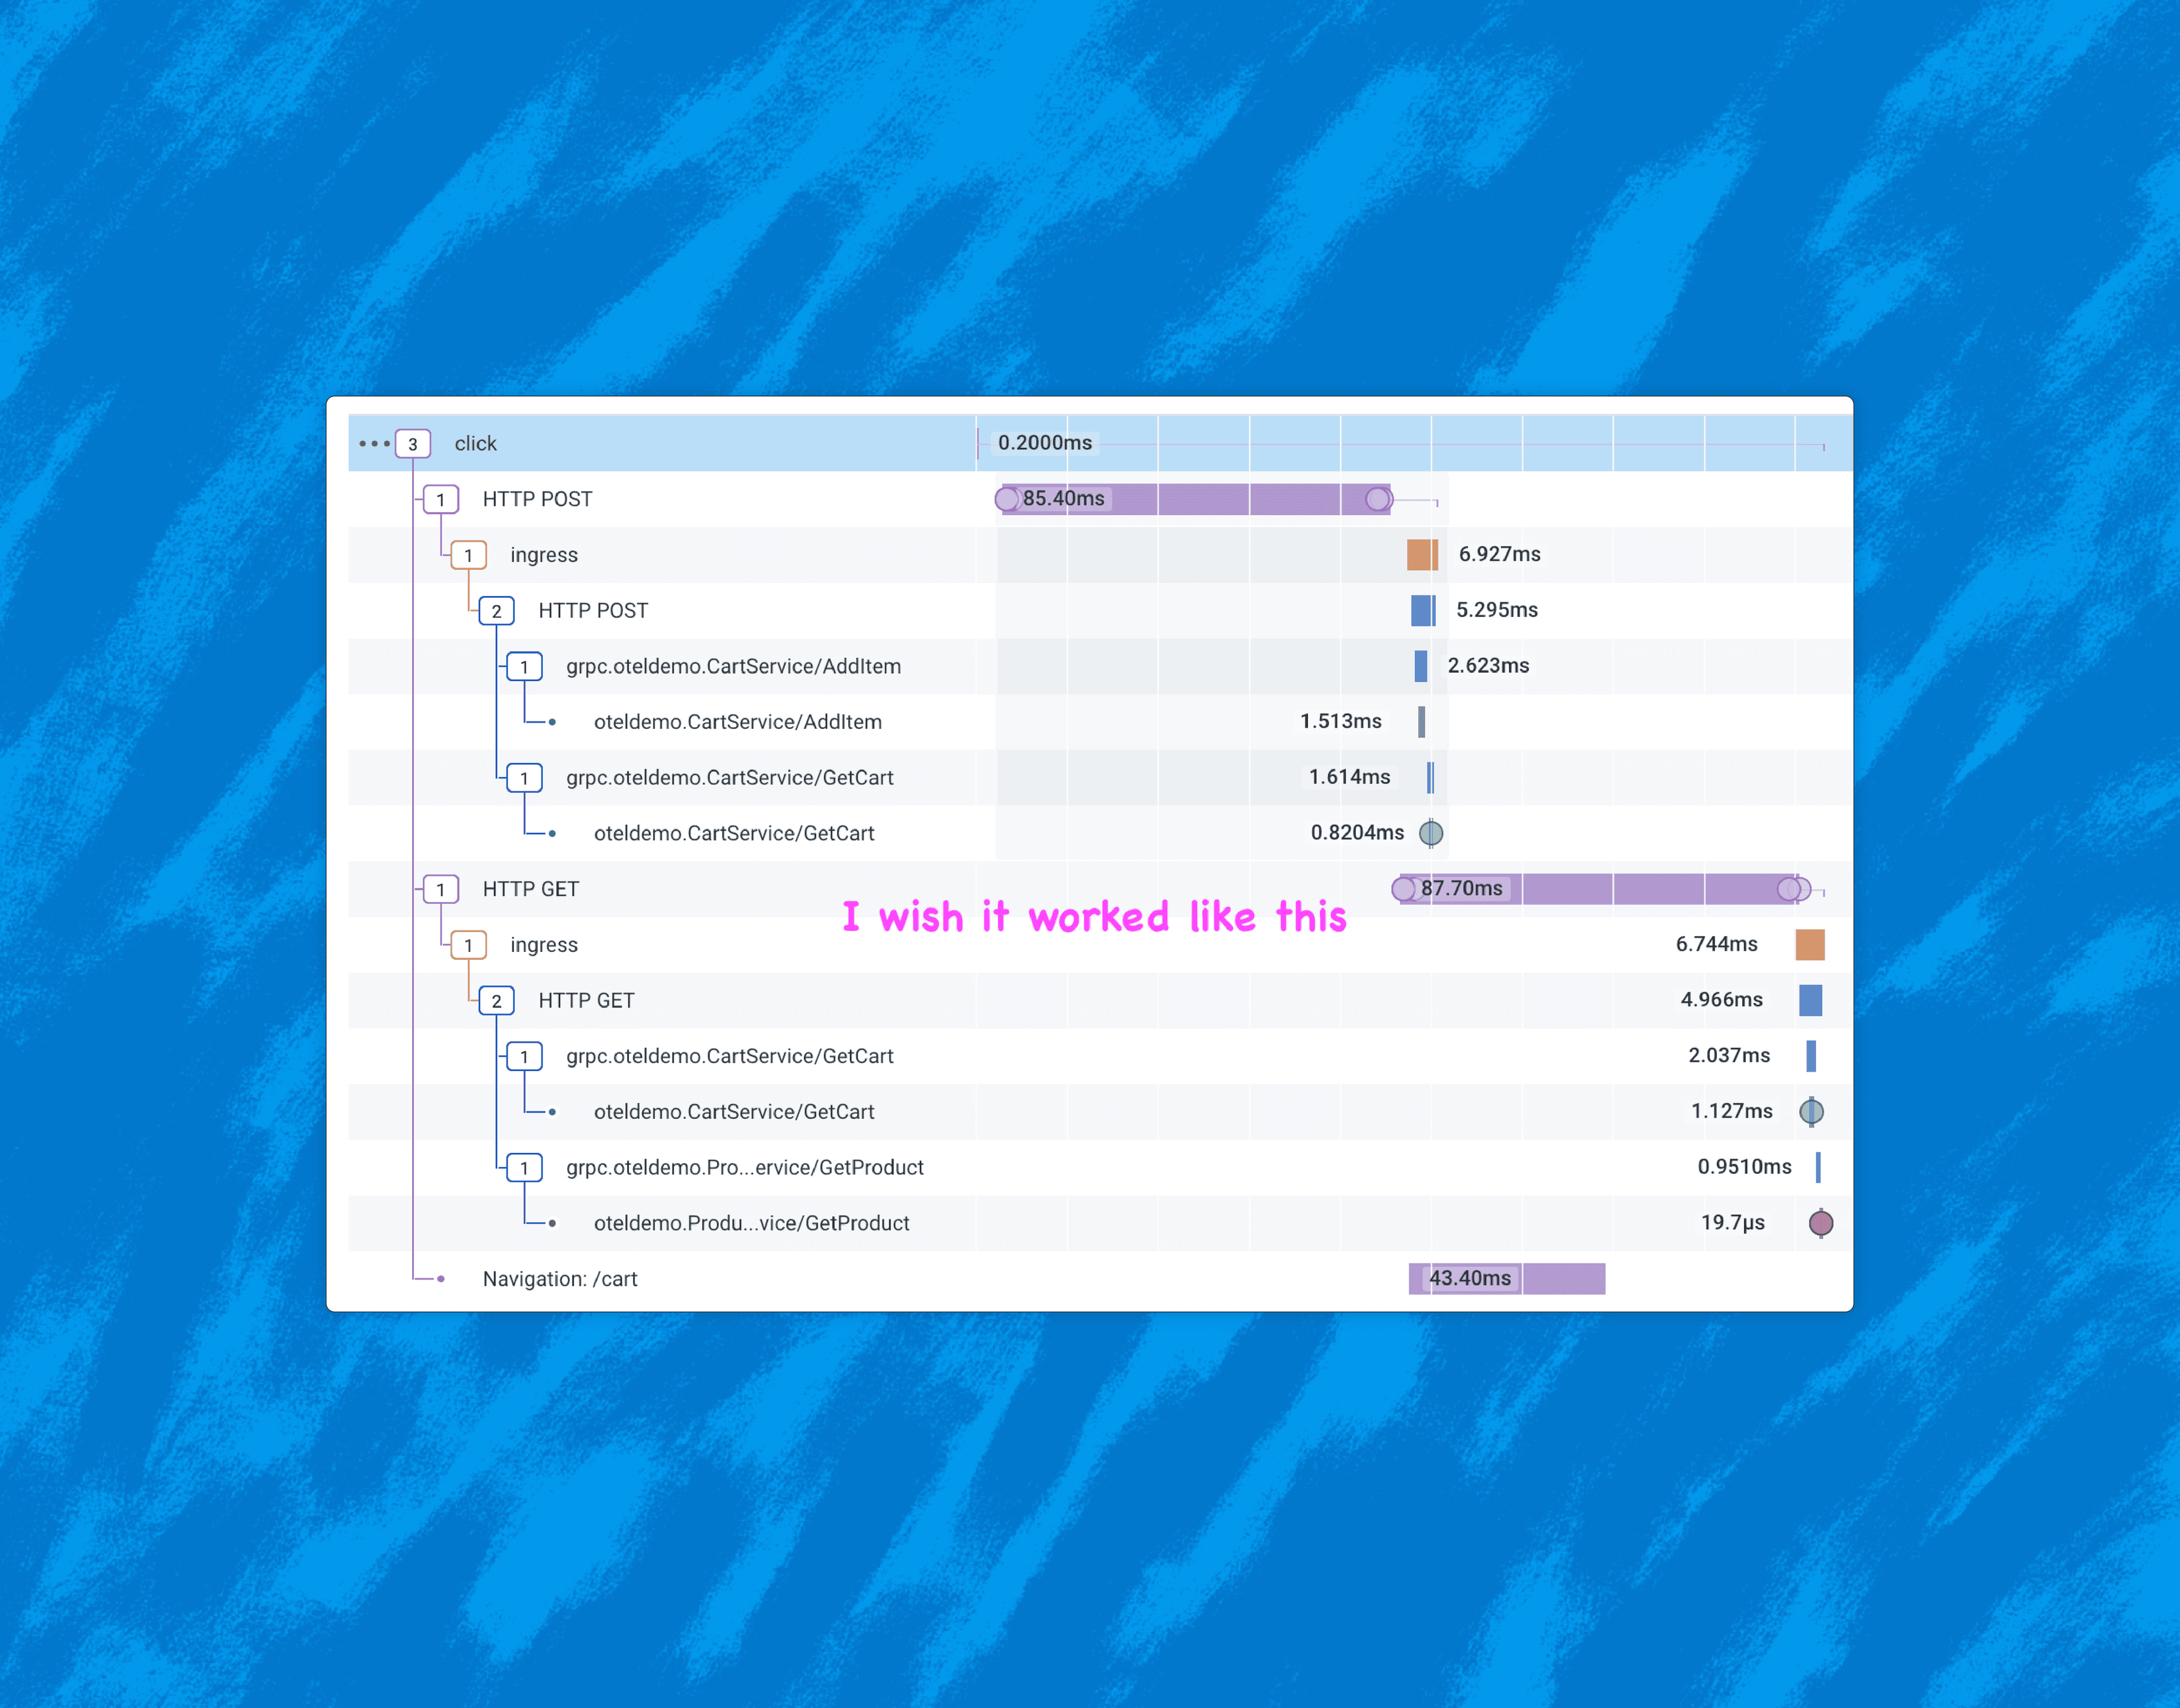
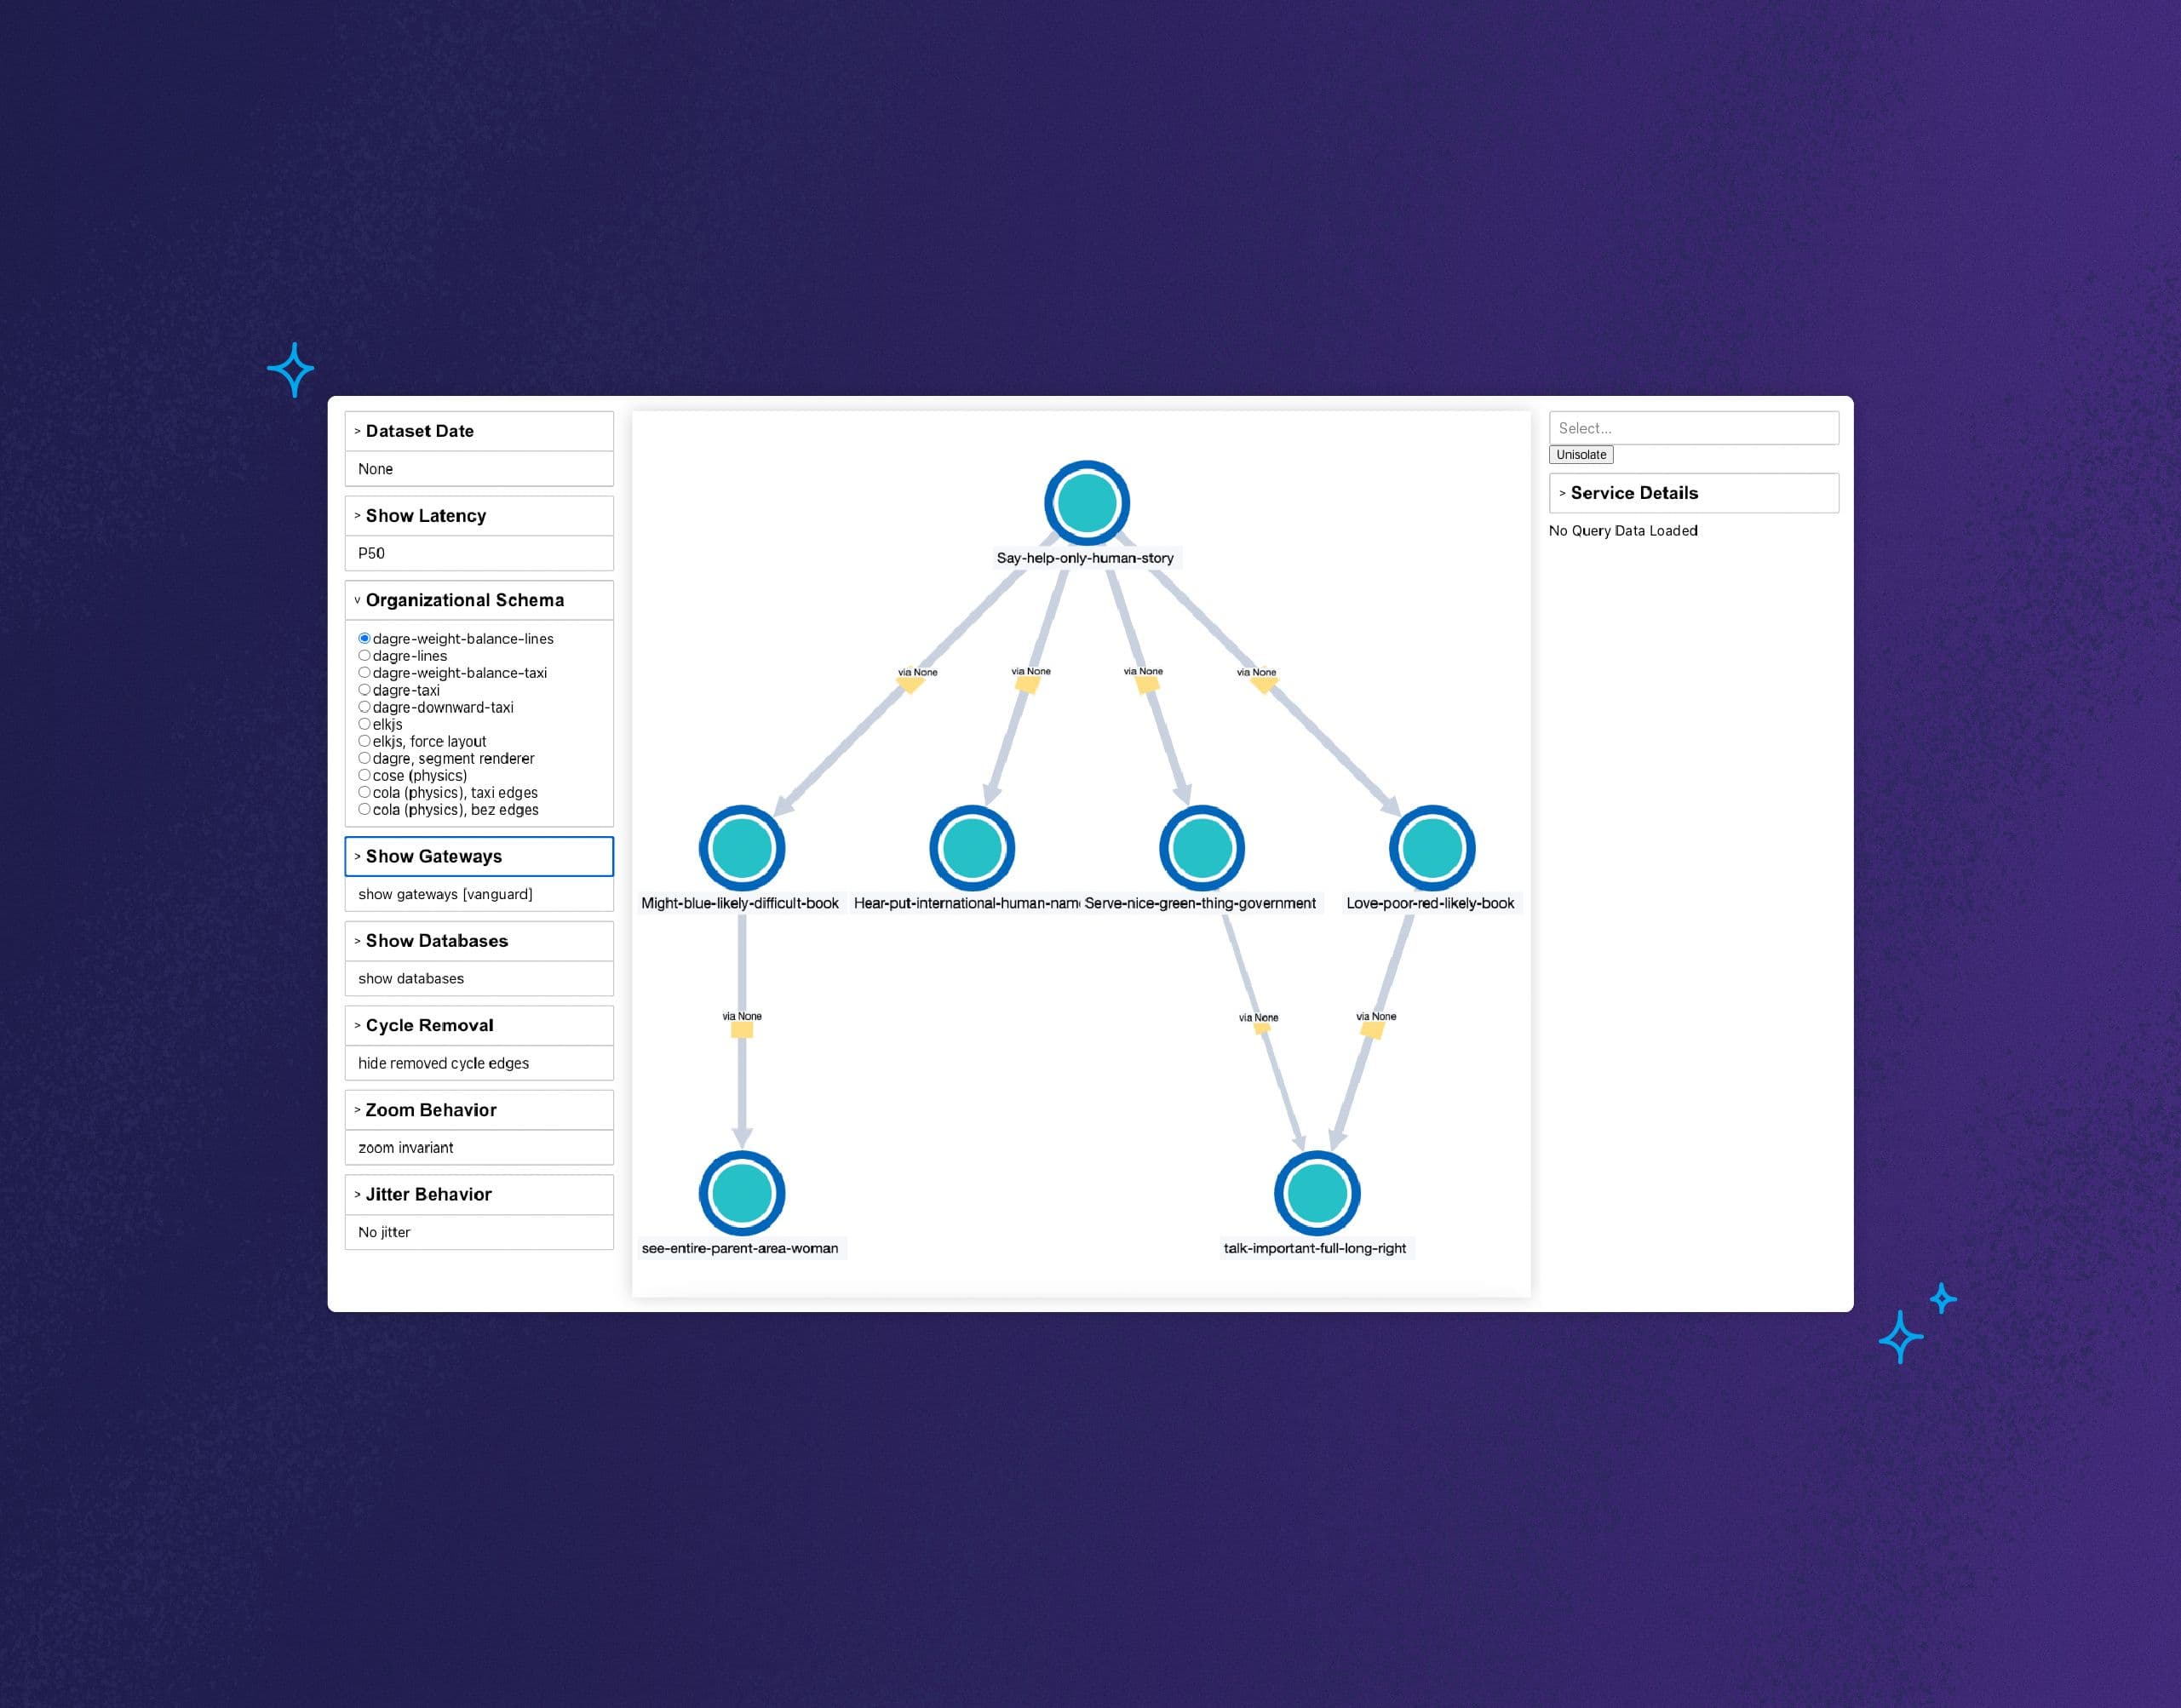
For a long time at Honeycomb, we envisioned using the tracing data you send us to generate a service map. If you’re unfamiliar, a service map is a graph-like visualization of your system architecture that shows all of its components and dependencies. We didn’t want it to be a static service map, though—the kind you’d view once before going “huh, neat”—and then never looking at it again. We wanted to build an actually useful, uniquely Honeycomb-y service map that could become an integral part of your team’s observability workflow.