Agent observability for production teams
Trace agent decisions, tool calls, handoffs, and token cost across every production workflow, all in one view.
What is agent observability?
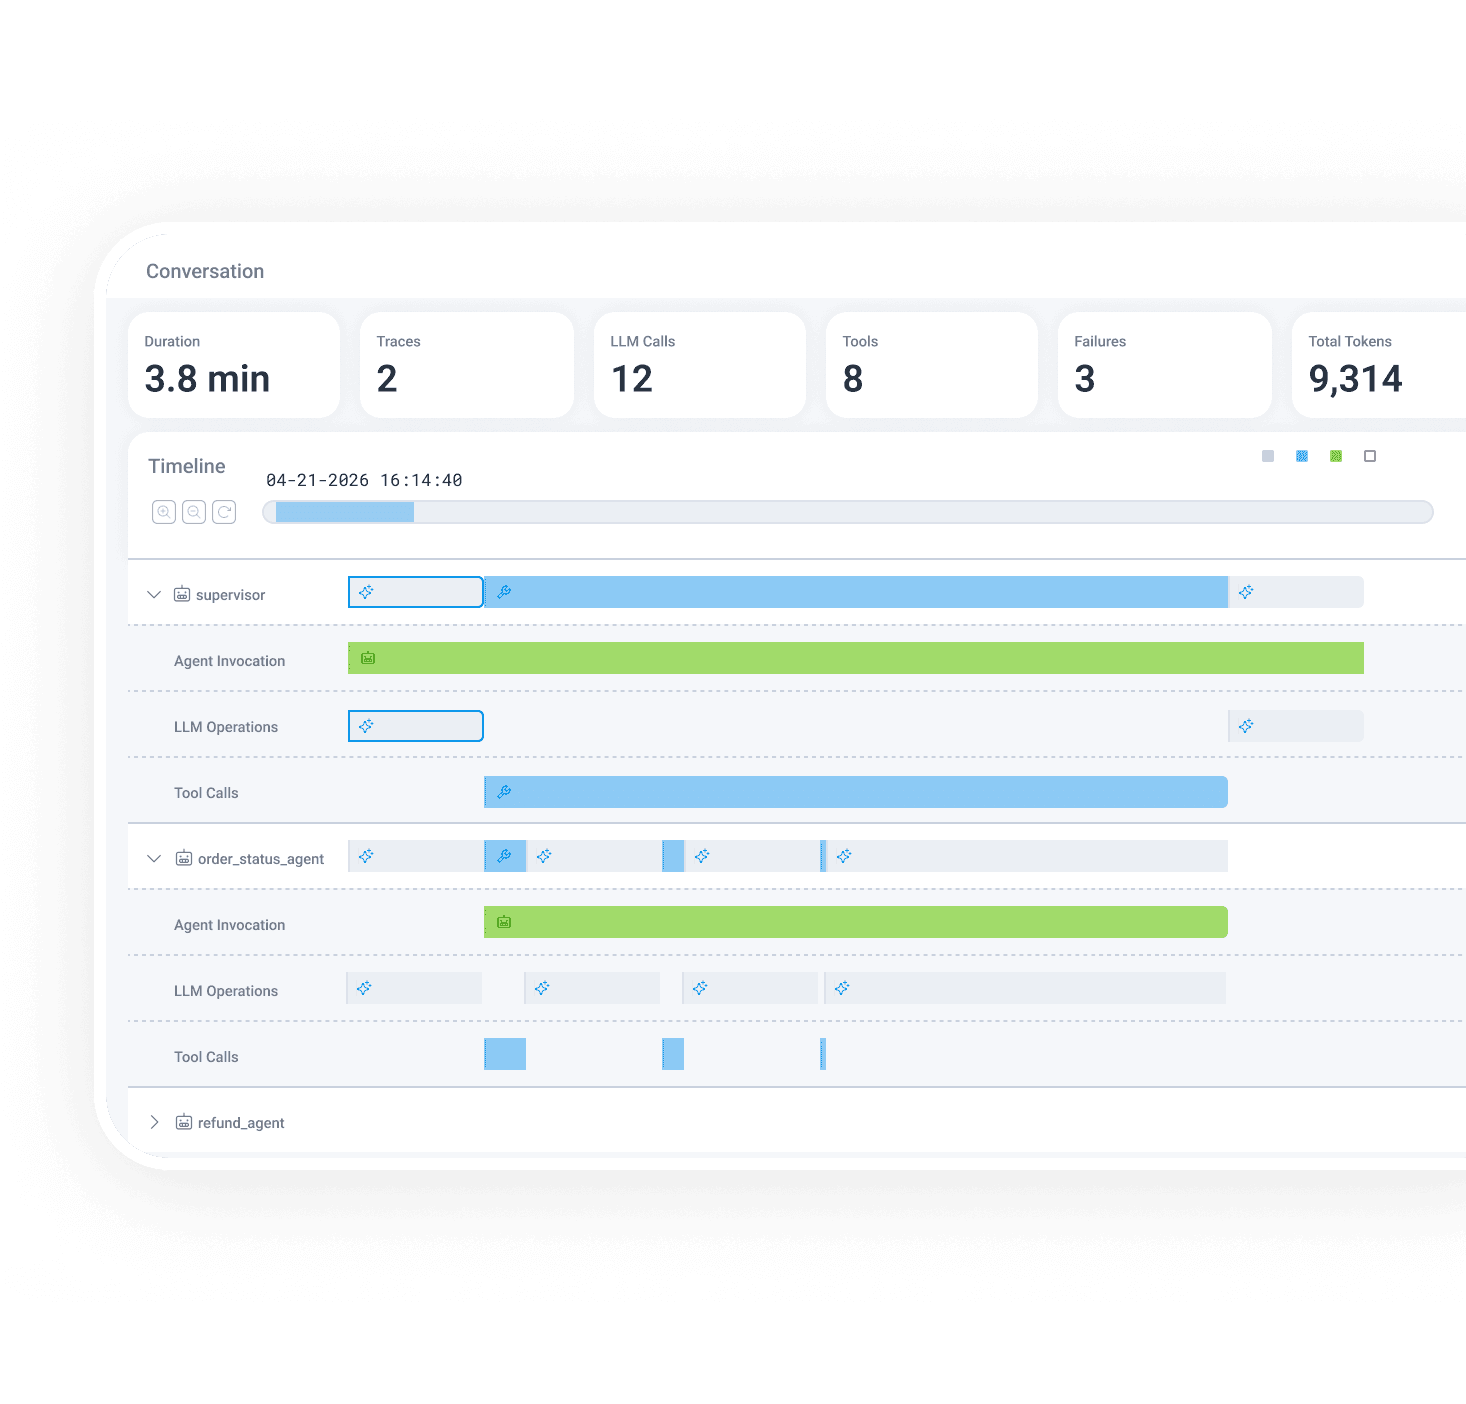
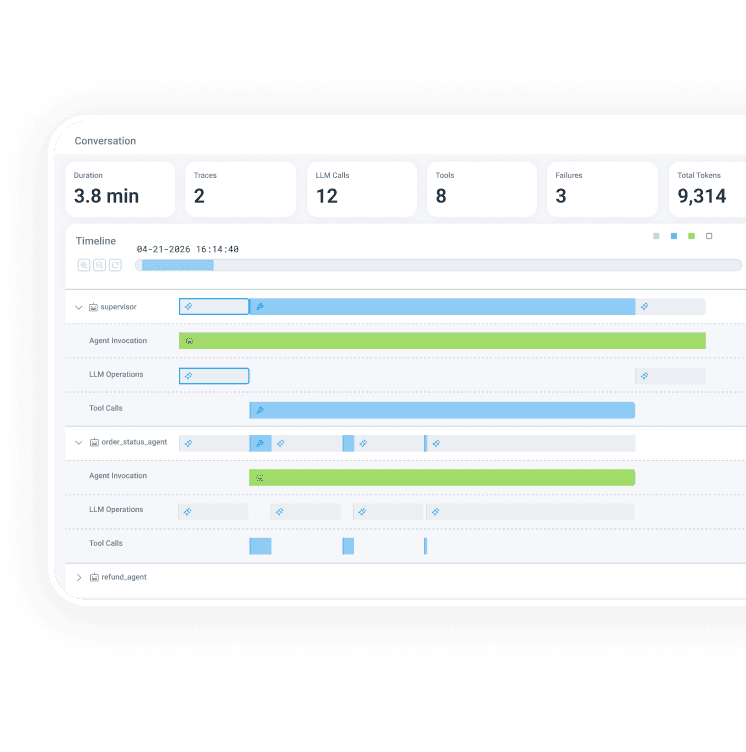
Agent observability is the continuous practice of tracing, monitoring, and evaluating the end-to-end reasoning and execution paths of AI agents. Agent observability gives you visibility into how your AI agents actually behave in production: the decisions they make, the tools they call, the handoffs between agents, the tokens they burn, and the outcomes they produce across multi-step workflows. It goes well beyond traditional system health checks that tell you a service is "up," and beyond single-model LLM observability that stops at the prompt and completion.
Agents are non-deterministic, multi-step, and long-running, which means a green dashboard can hide a workflow quietly falling apart. Agent observability connects every step of that workflow to the systems underneath it, so you can see the whole run, not a fragment.
Why you'll love Honeycomb
See every agent step
Follow prompts, tool calls, and handoffs end to end, so you debug what the agent actually did instead of guessing from a pile of aggregate logs.
Control cost as you ship
Tie token spend to feature, environment, and outcome, so you know exactly what each run costs and which features are actually earning their keep.
Catch agents going off the rails
Surface loops, retries, and runaway agents the moment they start, so a cost spike or quality regression never makes it to a customer.
See how it works
Agents are black boxes until you can watch how they think. Honeycomb turns every agent run into a queryable trace, from the first prompt to the last downstream API call. Watch a demo or try it for yourself in our sandbox, no registration required.
Join us for our virtual event with live Q&A
Learn how agents and humans work together at every layer. Get the first look at Innovation Week on November 3-4.
Agentic AI observability built for production debugging
Trace every agent run end to end
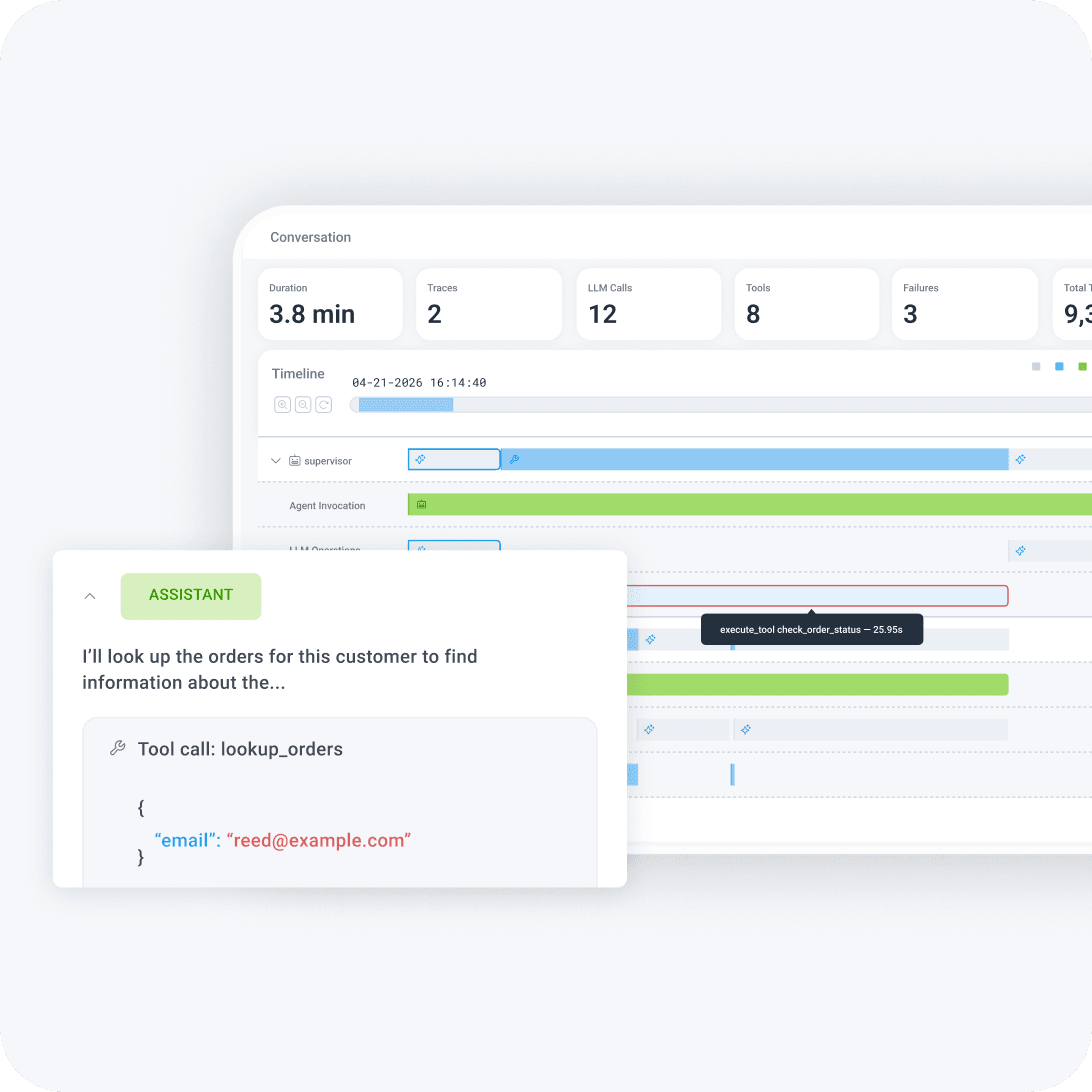
Honeycomb Agent Timeline captures one GenAI Conversation per request or agent run, with child spans for every LLM call, tool invocation, and handoff along the way. The full decision path is one click away from any alert or dashboard. No stitching traces together by hand, no reconstructing the sequence from memory, no wondering which agent handed off to which.
See cost per request, feature, and outcome
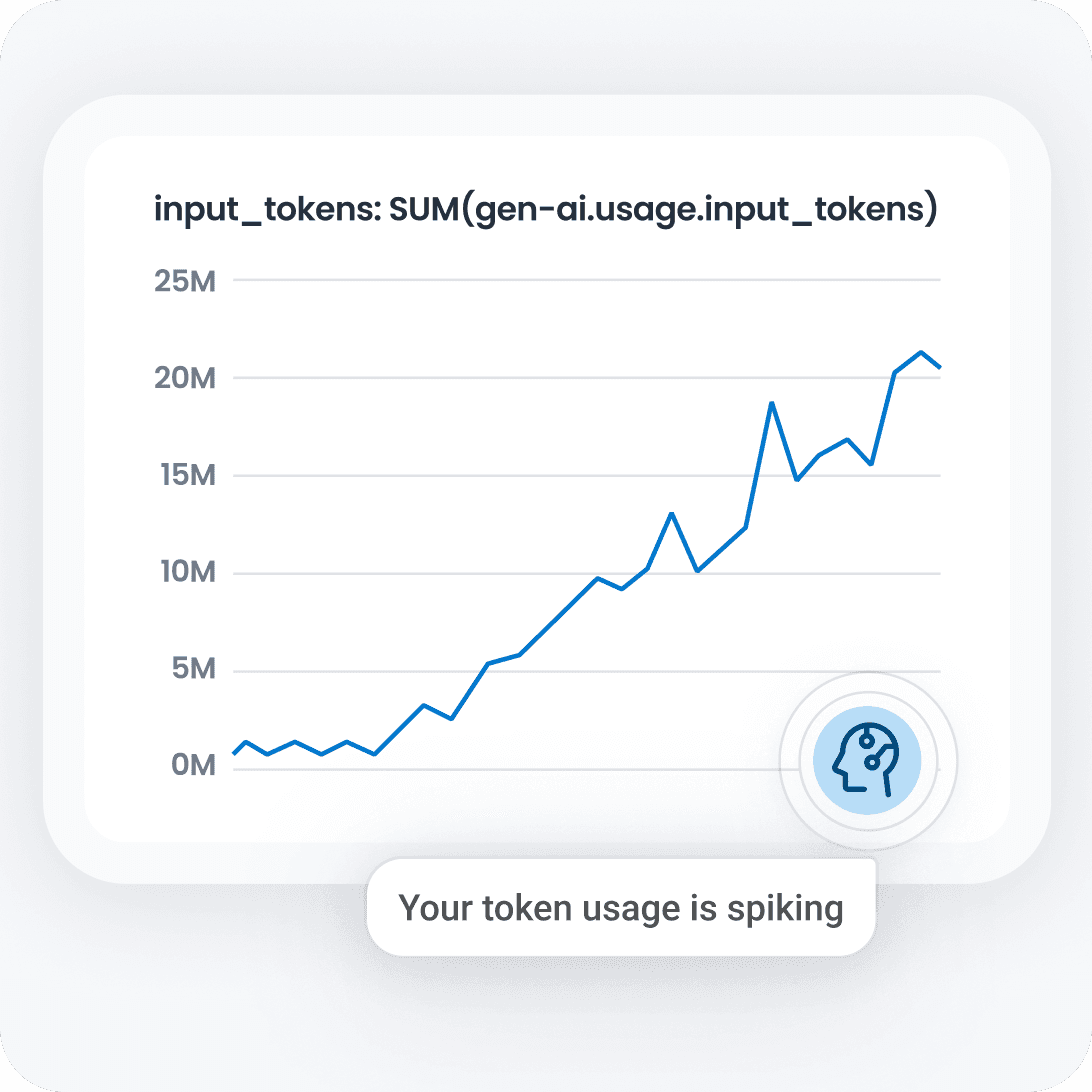
Read token usage straight from the provider response and tag it with the feature, environment, and outcome it belongs to. Now cost lives at the unit-economics level instead of buried in a monthly invoice. You can answer "what did this run cost, and was it worth it?" with data instead of a shrug.
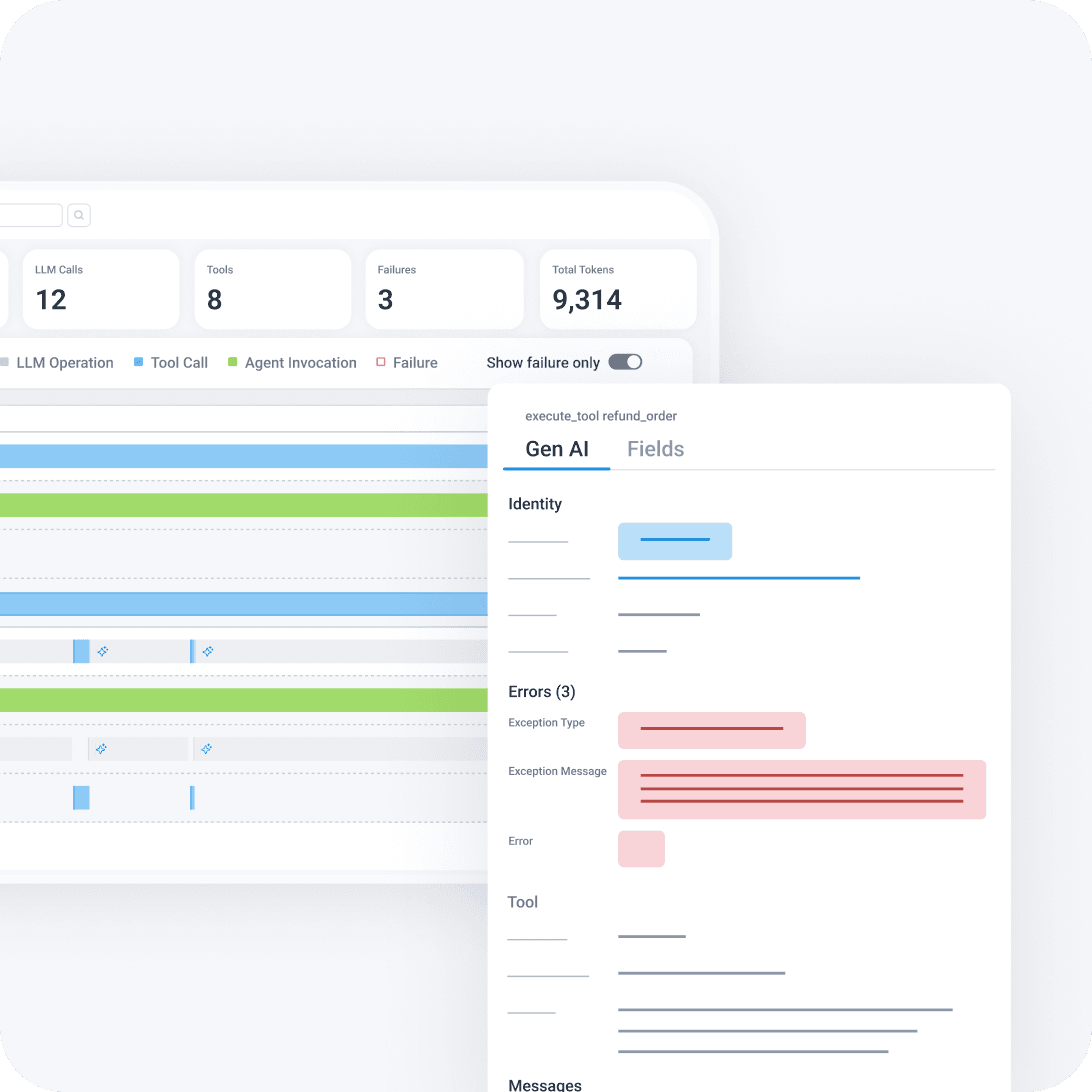
Catch loops, retries, and runaway agents
Get visibility into anomalous tokens per session, repeated tool calls, and agents that keep calling themselves. The nastiest cost spikes and quality regressions get flagged at the first occurrence, not at month-end when finance comes knocking. Non-deterministic does not have to mean unpredictable.
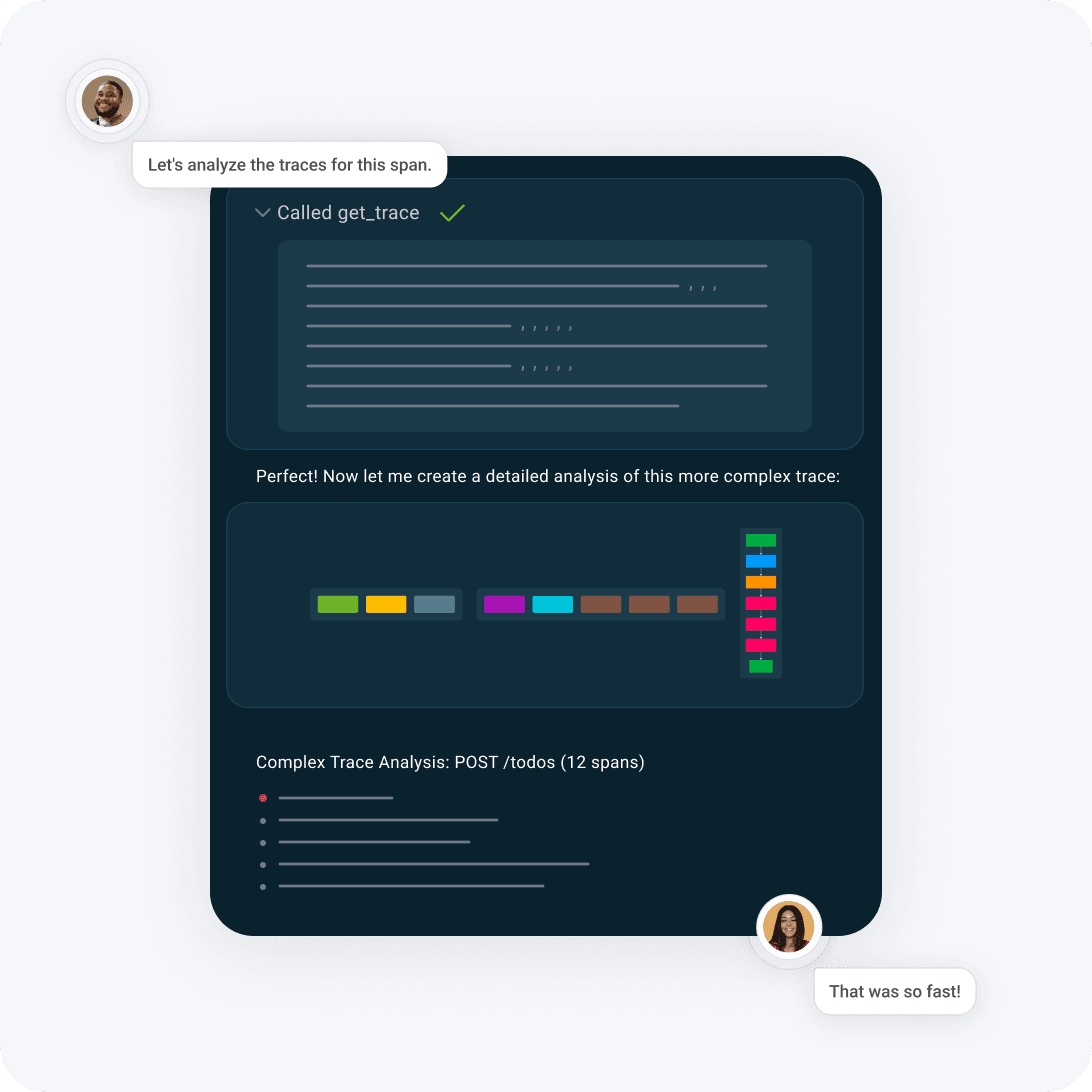
Debug high-cardinality agent behavior
Query and graph any span field you like: model, user, prompt version, tool, finish reason, and more. Because nothing is pre-aggregated, you can debug a bad output at the individual customer or session level instead of squinting at an average and hoping. This is where the "unknown unknowns" of agent behavior finally become findable.
We're generating like 50% more PRs than usual. That means that we're shipping 50% more code. We have 50% more deploys. The initial investment into tools like Honeycomb has really paid off and allowed us to handle that new volume. We still have the same number of engineers, they're just writing more code now. Being able to rely on Honeycomb there has been really great.

Eddie Bracho
DevOps Engineer, Mixpanel
Want to know more?
Talk to our team to arrange a custom demo or for help finding the right plan.