Meet the Author

Rox Williams
Senior Content Marketing Manager
The First of Her Name, Mother of Pugs, Breaker of Leashes, Khaleesi of the Goth Office, Rox is the Senior Content Marketing Manager at Honeycomb. She comes to us with a background in DevOps writing. In her spare time, you can find her at a vegan restaurant with her partner, or adopting too many senior pugs.
Explore Author's Blog

ICYMI: Is This Code Worth Running? Here’s How to Know
Over the last three months, we’ve been exploring what about software development and observability changes with AI, and what doesn’t. Our conclusion: these five principles will still remain true, even when 90% of the code is AI-driven.


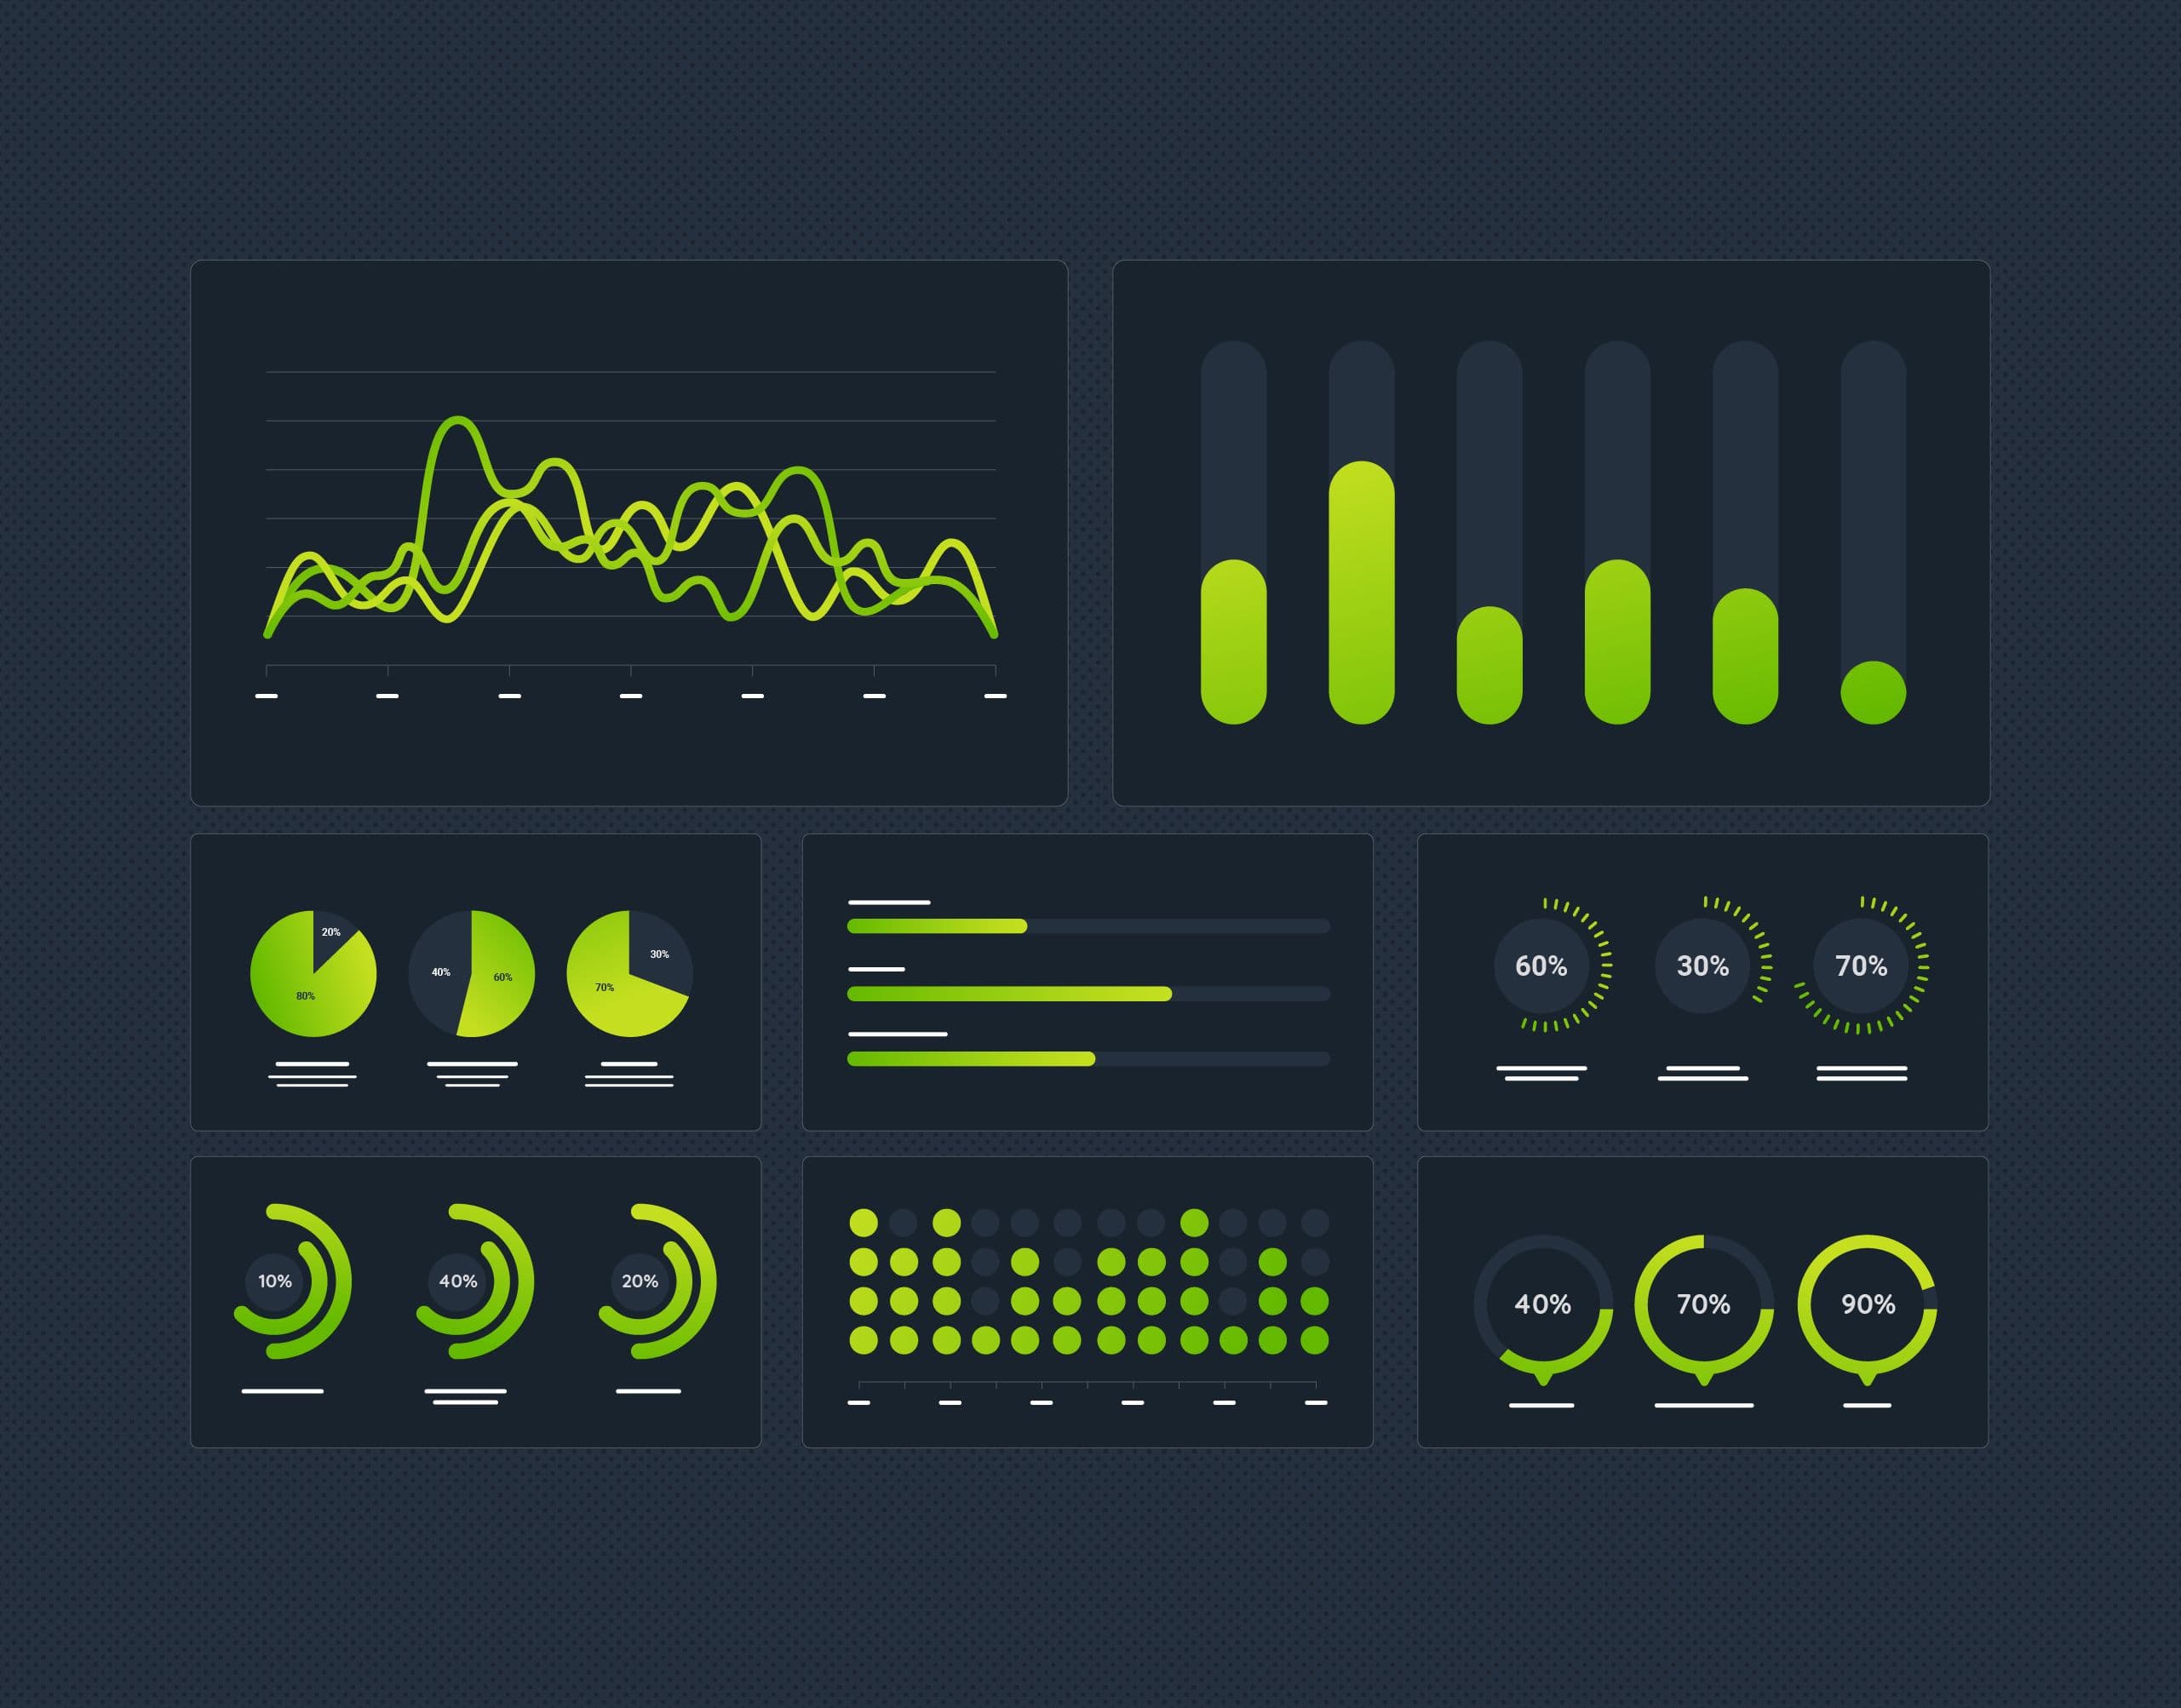


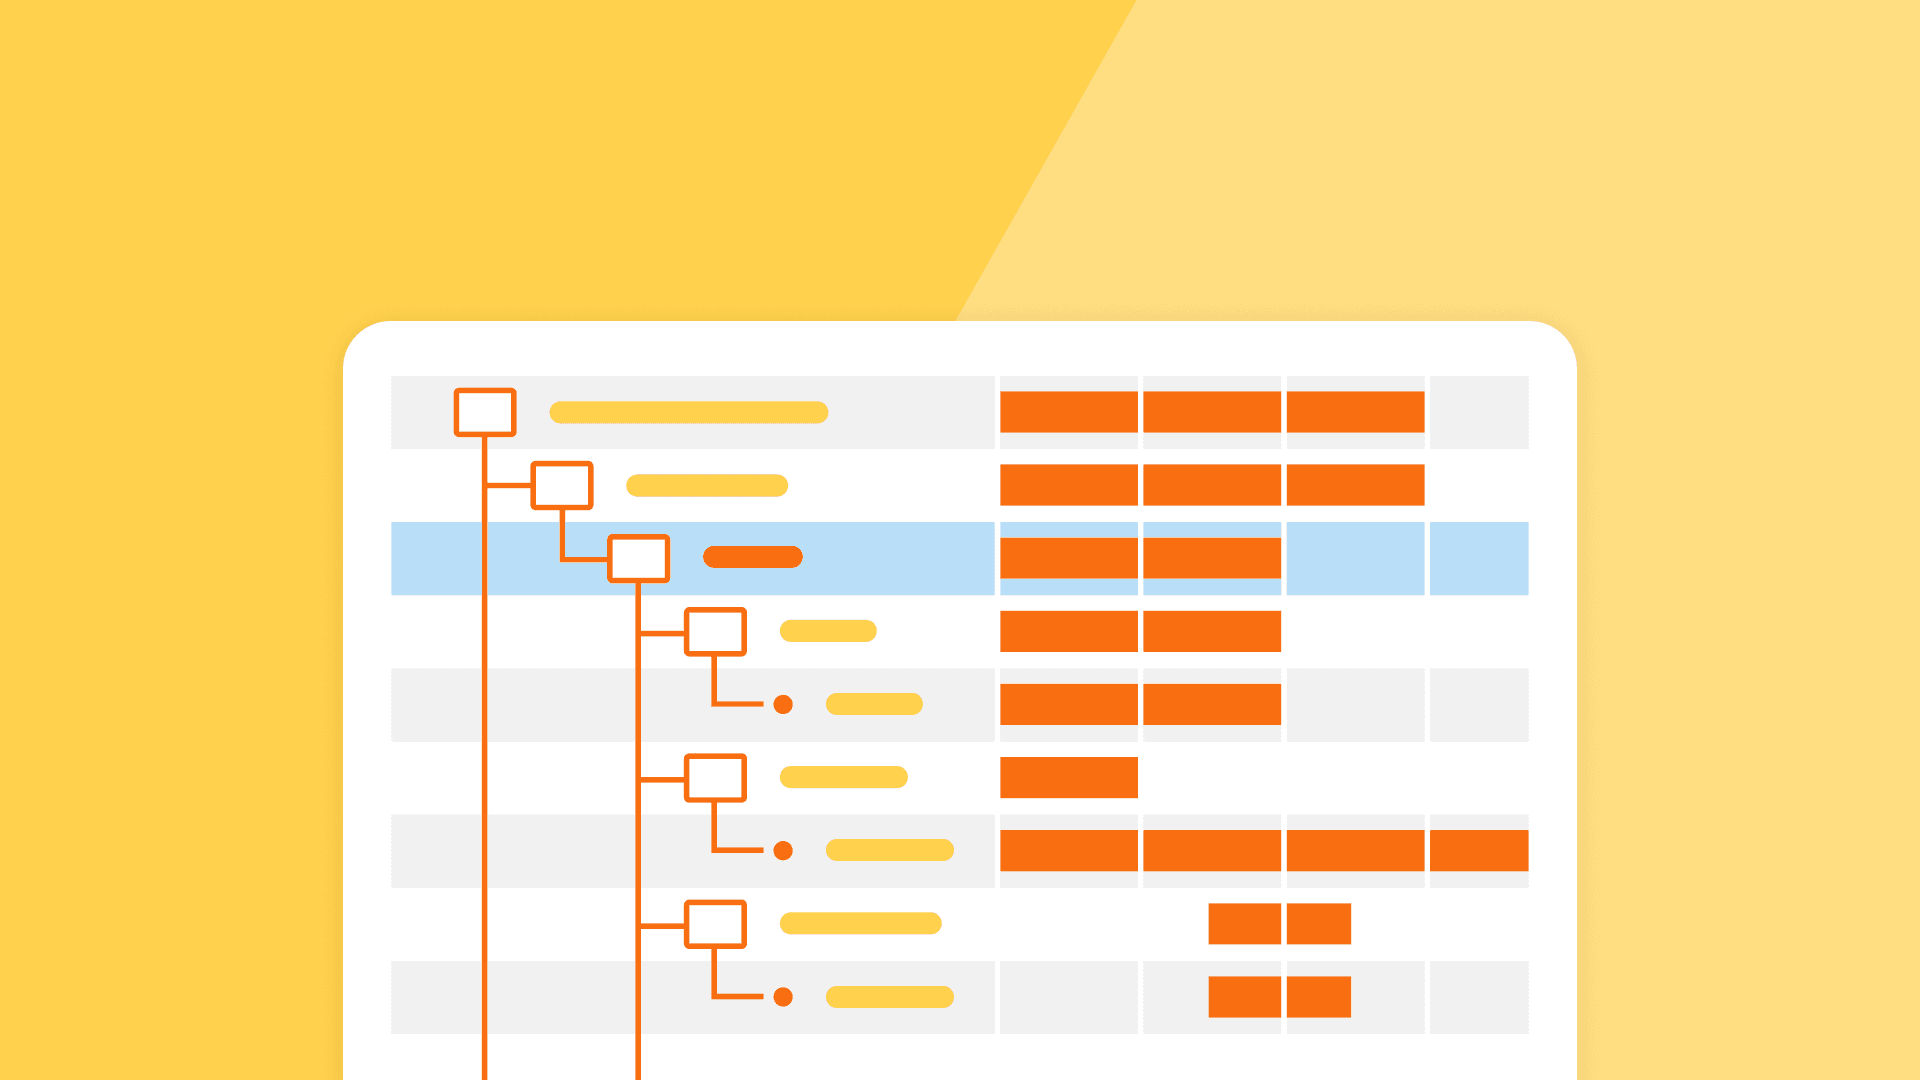
How Product Managers Can Benefit From Honeycomb
Observability tools like Honeycomb are built for engineers, not PM teams… but that doesn’t mean there’s no benefit to having your PMs in Honeycomb. Whether it’s debugging a weird customer issue or tracking how a feature is used in the wild, observability gives PMs something traditional product tools can’t: real-time answers with full context, down to a single user.

7 Alternatives to New Relic
New Relic is a well-known application performance monitoring (APM) solution that helps engineers visualize, monitor, and troubleshoot their systems. As businesses evolve, engineers must deliver new capabilities at greater scale and speed, often while managing an increasing number of services and systems. This naturally raises the question: what tools can help?
What Is OpenTracing? A Walk Down Tracing History
OpenTracing was created to solve this problem by providing a vendor-neutral implementation to instrument code for distributed tracing. Over time, the community recognized the need for a broader, unified standard that went beyond tracing to also include metrics and logs.
The Guide to Kubernetes Debugging
Kubernetes is widely used for deploying, scaling, and managing systems and applications and is an industry standard for container orchestration. Google engineers originally developed Kubernetes as an open-source project. Its first release was in September 2014, and since then, it has matured into a graduate project maintained by the Cloud Native Computing Foundation (CNCF). With the complexities of scale and distributed systems, debugging in Kubernetes environments can be difficult.

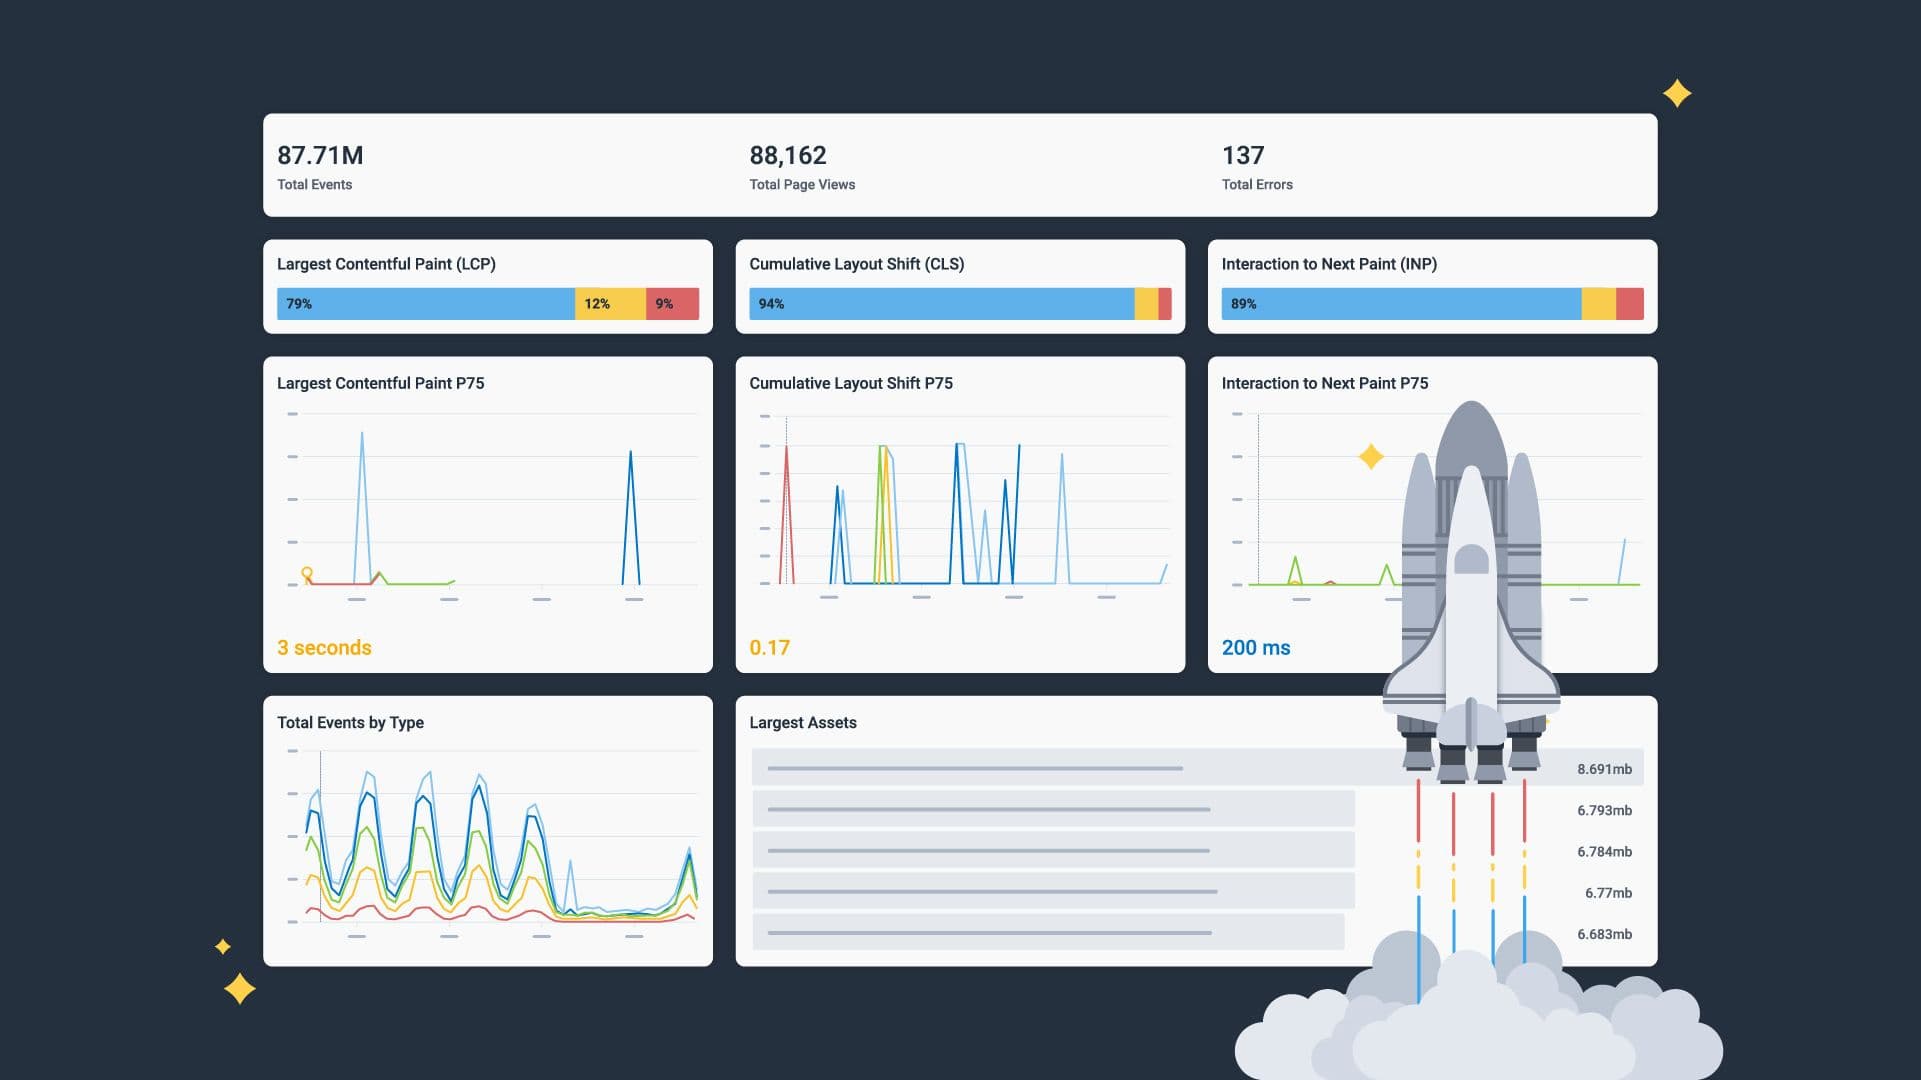
Frontend Monitoring: Deliver Seamless and Performant User Experiences
In this blog, we’ll share the fundamentals of frontend monitoring, including what you need to know about performance measurement and strategies for staying ahead of monitoring challenges to deliver high-performing, user-centric applications.
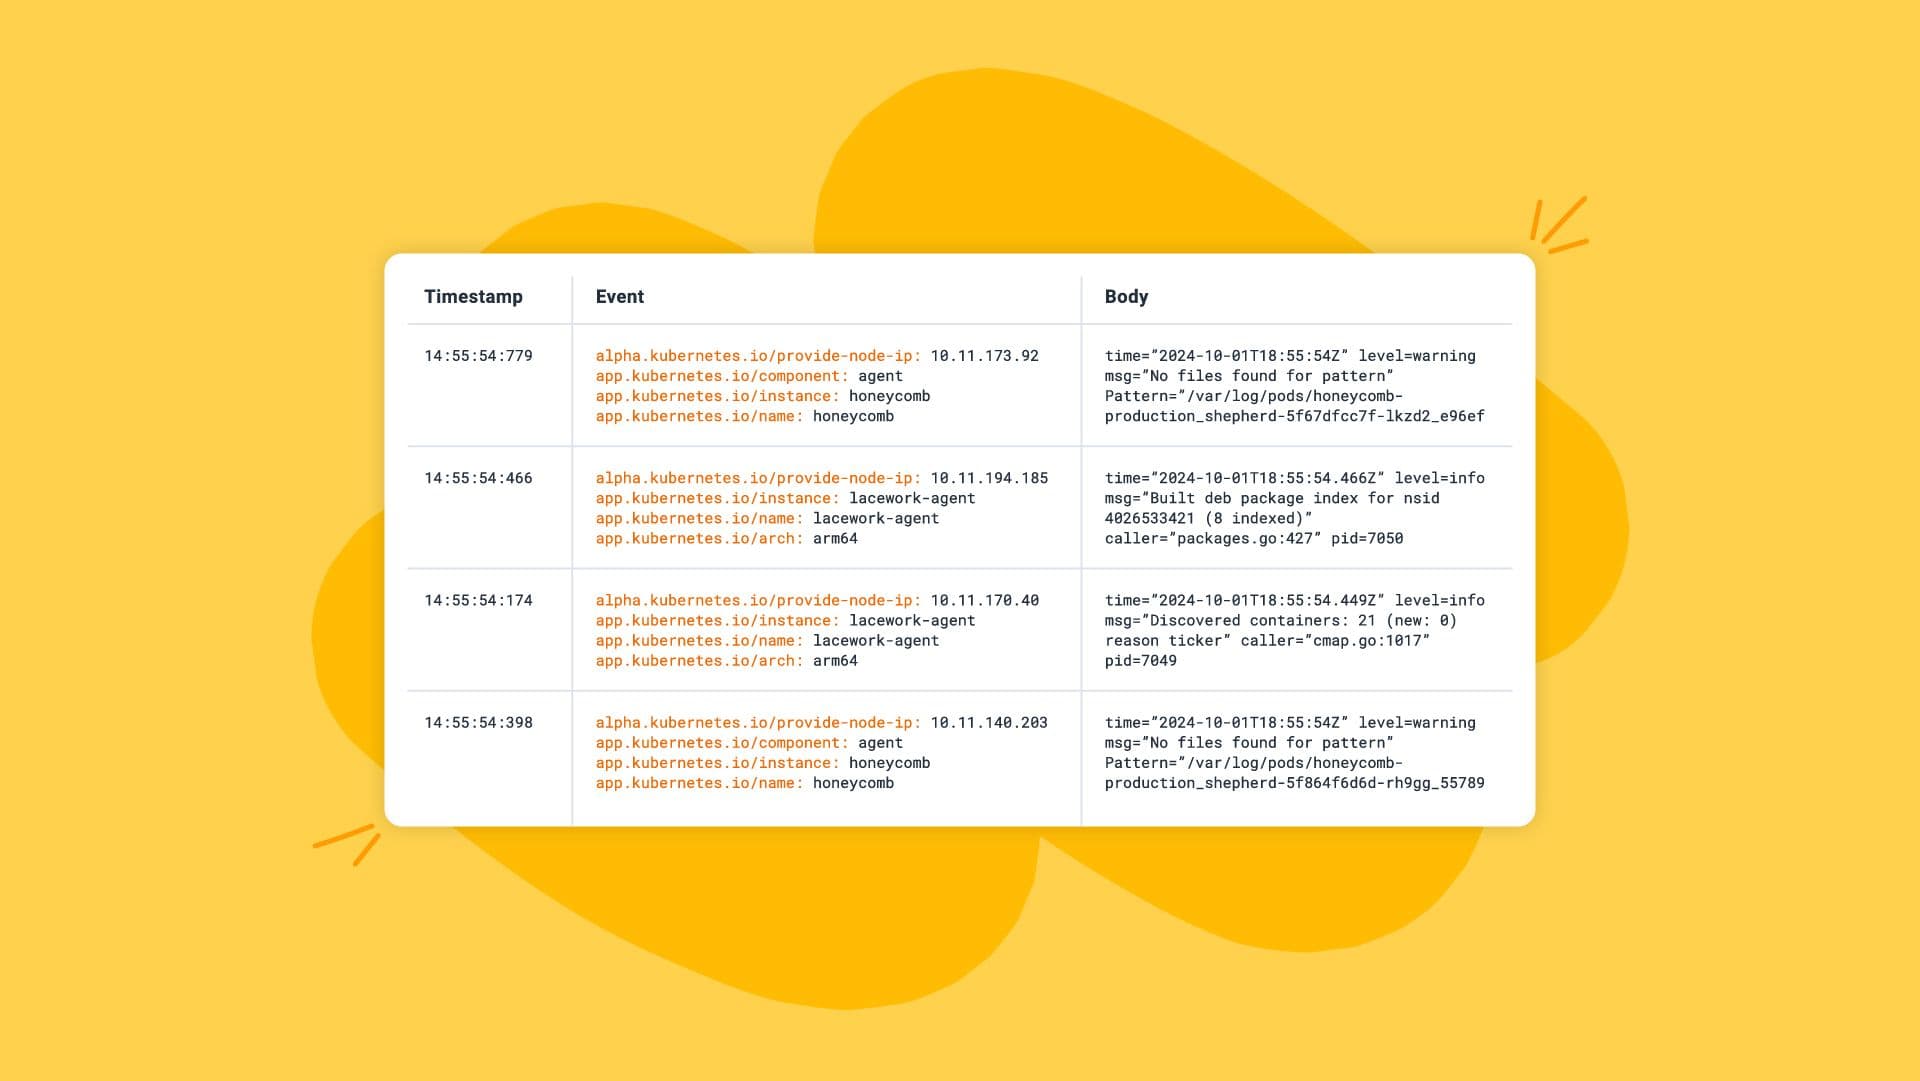
The Log Monitoring Guide for Sweet Insights
Logs are more than just records. With proper log monitoring, they become the honey that sweetens observability. Observability is your ability to understand and optimize your system’s behavior. Turning raw logs into actionable insights requires the right tools, practices, and insights. This blog post is a guide on log monitoring key concepts and best practices for sweetening your observability.

2024 Wrapped: 6 Key Observability Trends
Another one in the history books: 2024 is (almost!) over. The OpenObservability Talks podcast, hosted by Dotan Horovits, recently featured a lively discussion with Charity Majors, Co-founder and CTO of Honeycomb, to reflect on the trends, achievements, and future of observability.

Beyond Monitoring: A Guide to Cloud Observability
With more and often smaller processes, cloud-native architectures have driven the need for better insights into our software—a way to look into how these processes fit together. To accomplish this insight, we use an approach that goes beyond traditional monitoring and provides deep insights into system behavior. This approach is cloud observability.
Tracing the Line: Understanding Logs vs. Traces
In the software space, we spend a lot of time defining the terminology that describes our roles, implementations, and ways of working. These terms help us share fundamental concepts that improve our software and let us better manage our software solutions. To optimize your software solutions and help you implement system observability, this blog post will share the key differences between two important terms: traces and logs.
An Engineer’s Checklist of Logging Best Practices
The best DevOps and SRE teams have shifted their approach to monitoring and logging their systems. These teams debug problems cohesively and rationally, regardless of the system’s complexity. Gone are the days of having a slew of logs that fail to explain the cause of alerts, system failures, and other unknowns.