See how your apps, services and experiences connect.
Let AI explore production data to resolve issues faster.
Understand agent behavior, performance and cost in production.
Collect, control and route telemetry across your stack.
Maintain reliability and efficiency at enterprise scale.
Explore solutions for specific engineering challenges.
The industries and company sizes Honeycomb supports.
Connect Honeycomb with the technologies across your stack.
See how Honeycomb improves your business and engineering outcomes.
See how teams use Honeycomb to achieve measurable results.
Understand how Honeycomb differs from other approaches.
Jodi Sloan
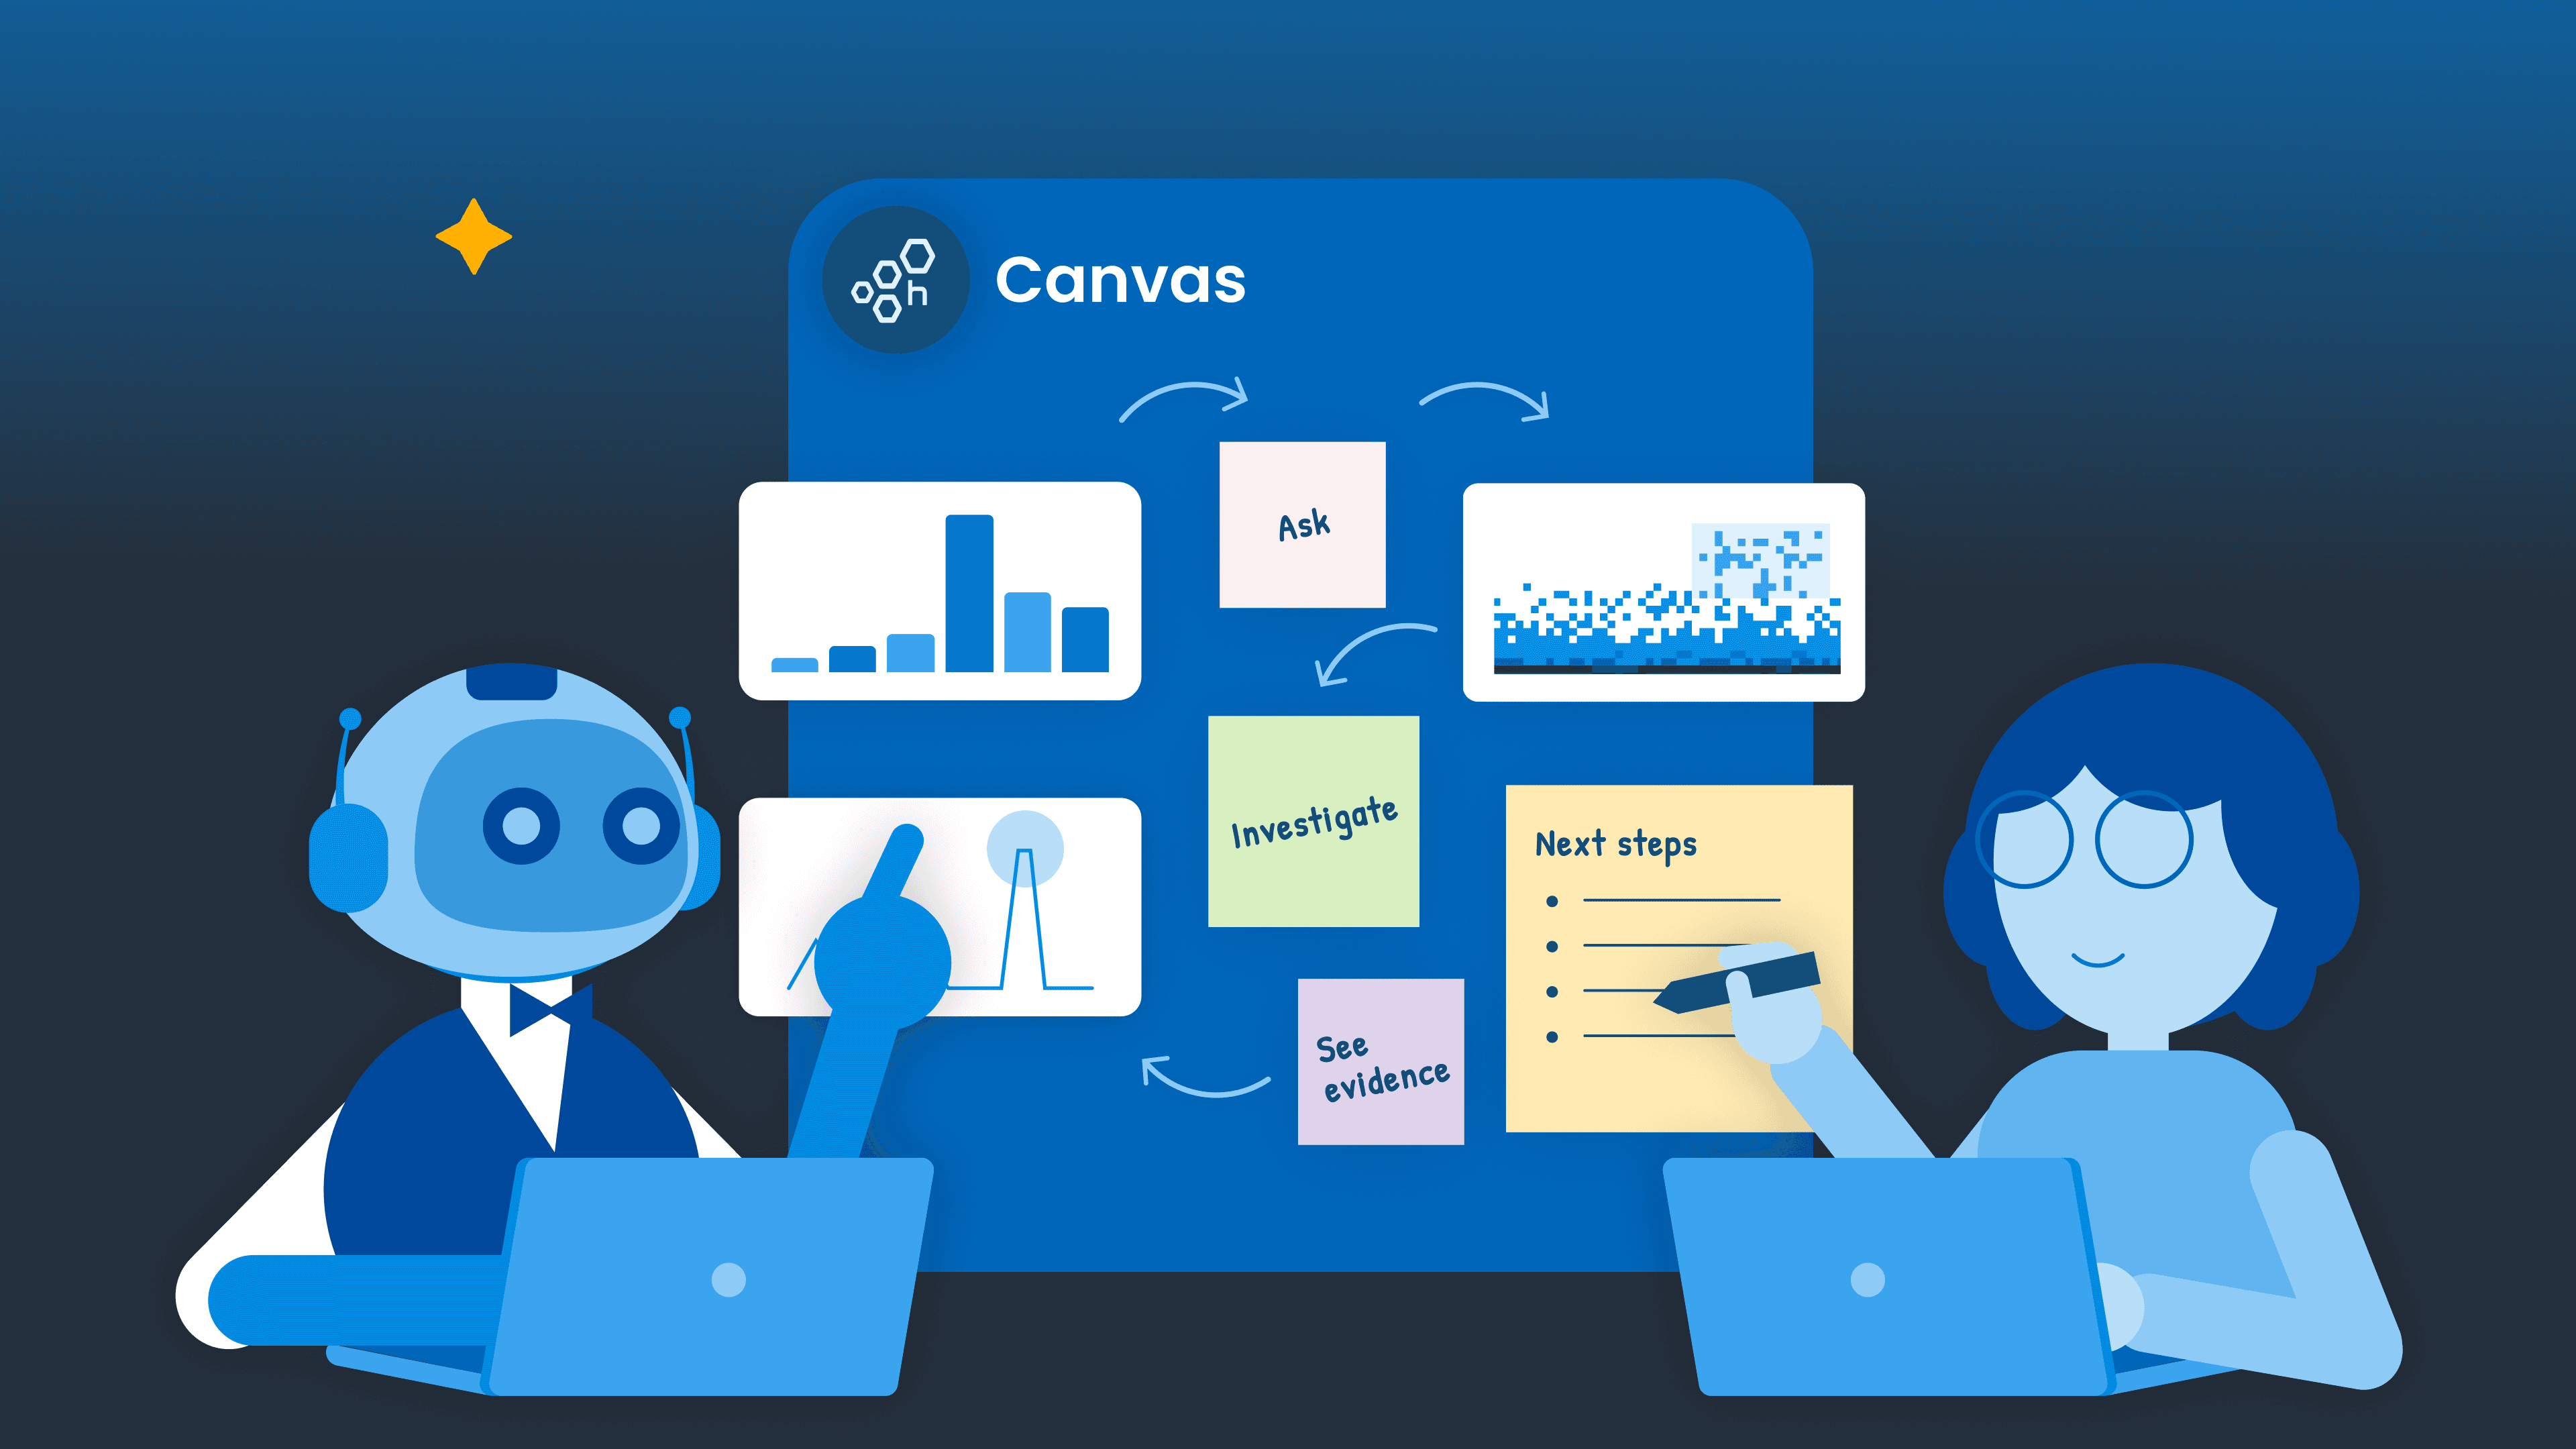
AI agents need a real feedback loop, not just reactive debugging. This post walks through how Honeycomb's Canvas powers each stage—instrumenting agents with OpenTelemetry, understanding a single run, finding the problems worth fixing, shipping the fix, and proving it worked—plus tips for getting the most out of Canvas.
Ken Rimple
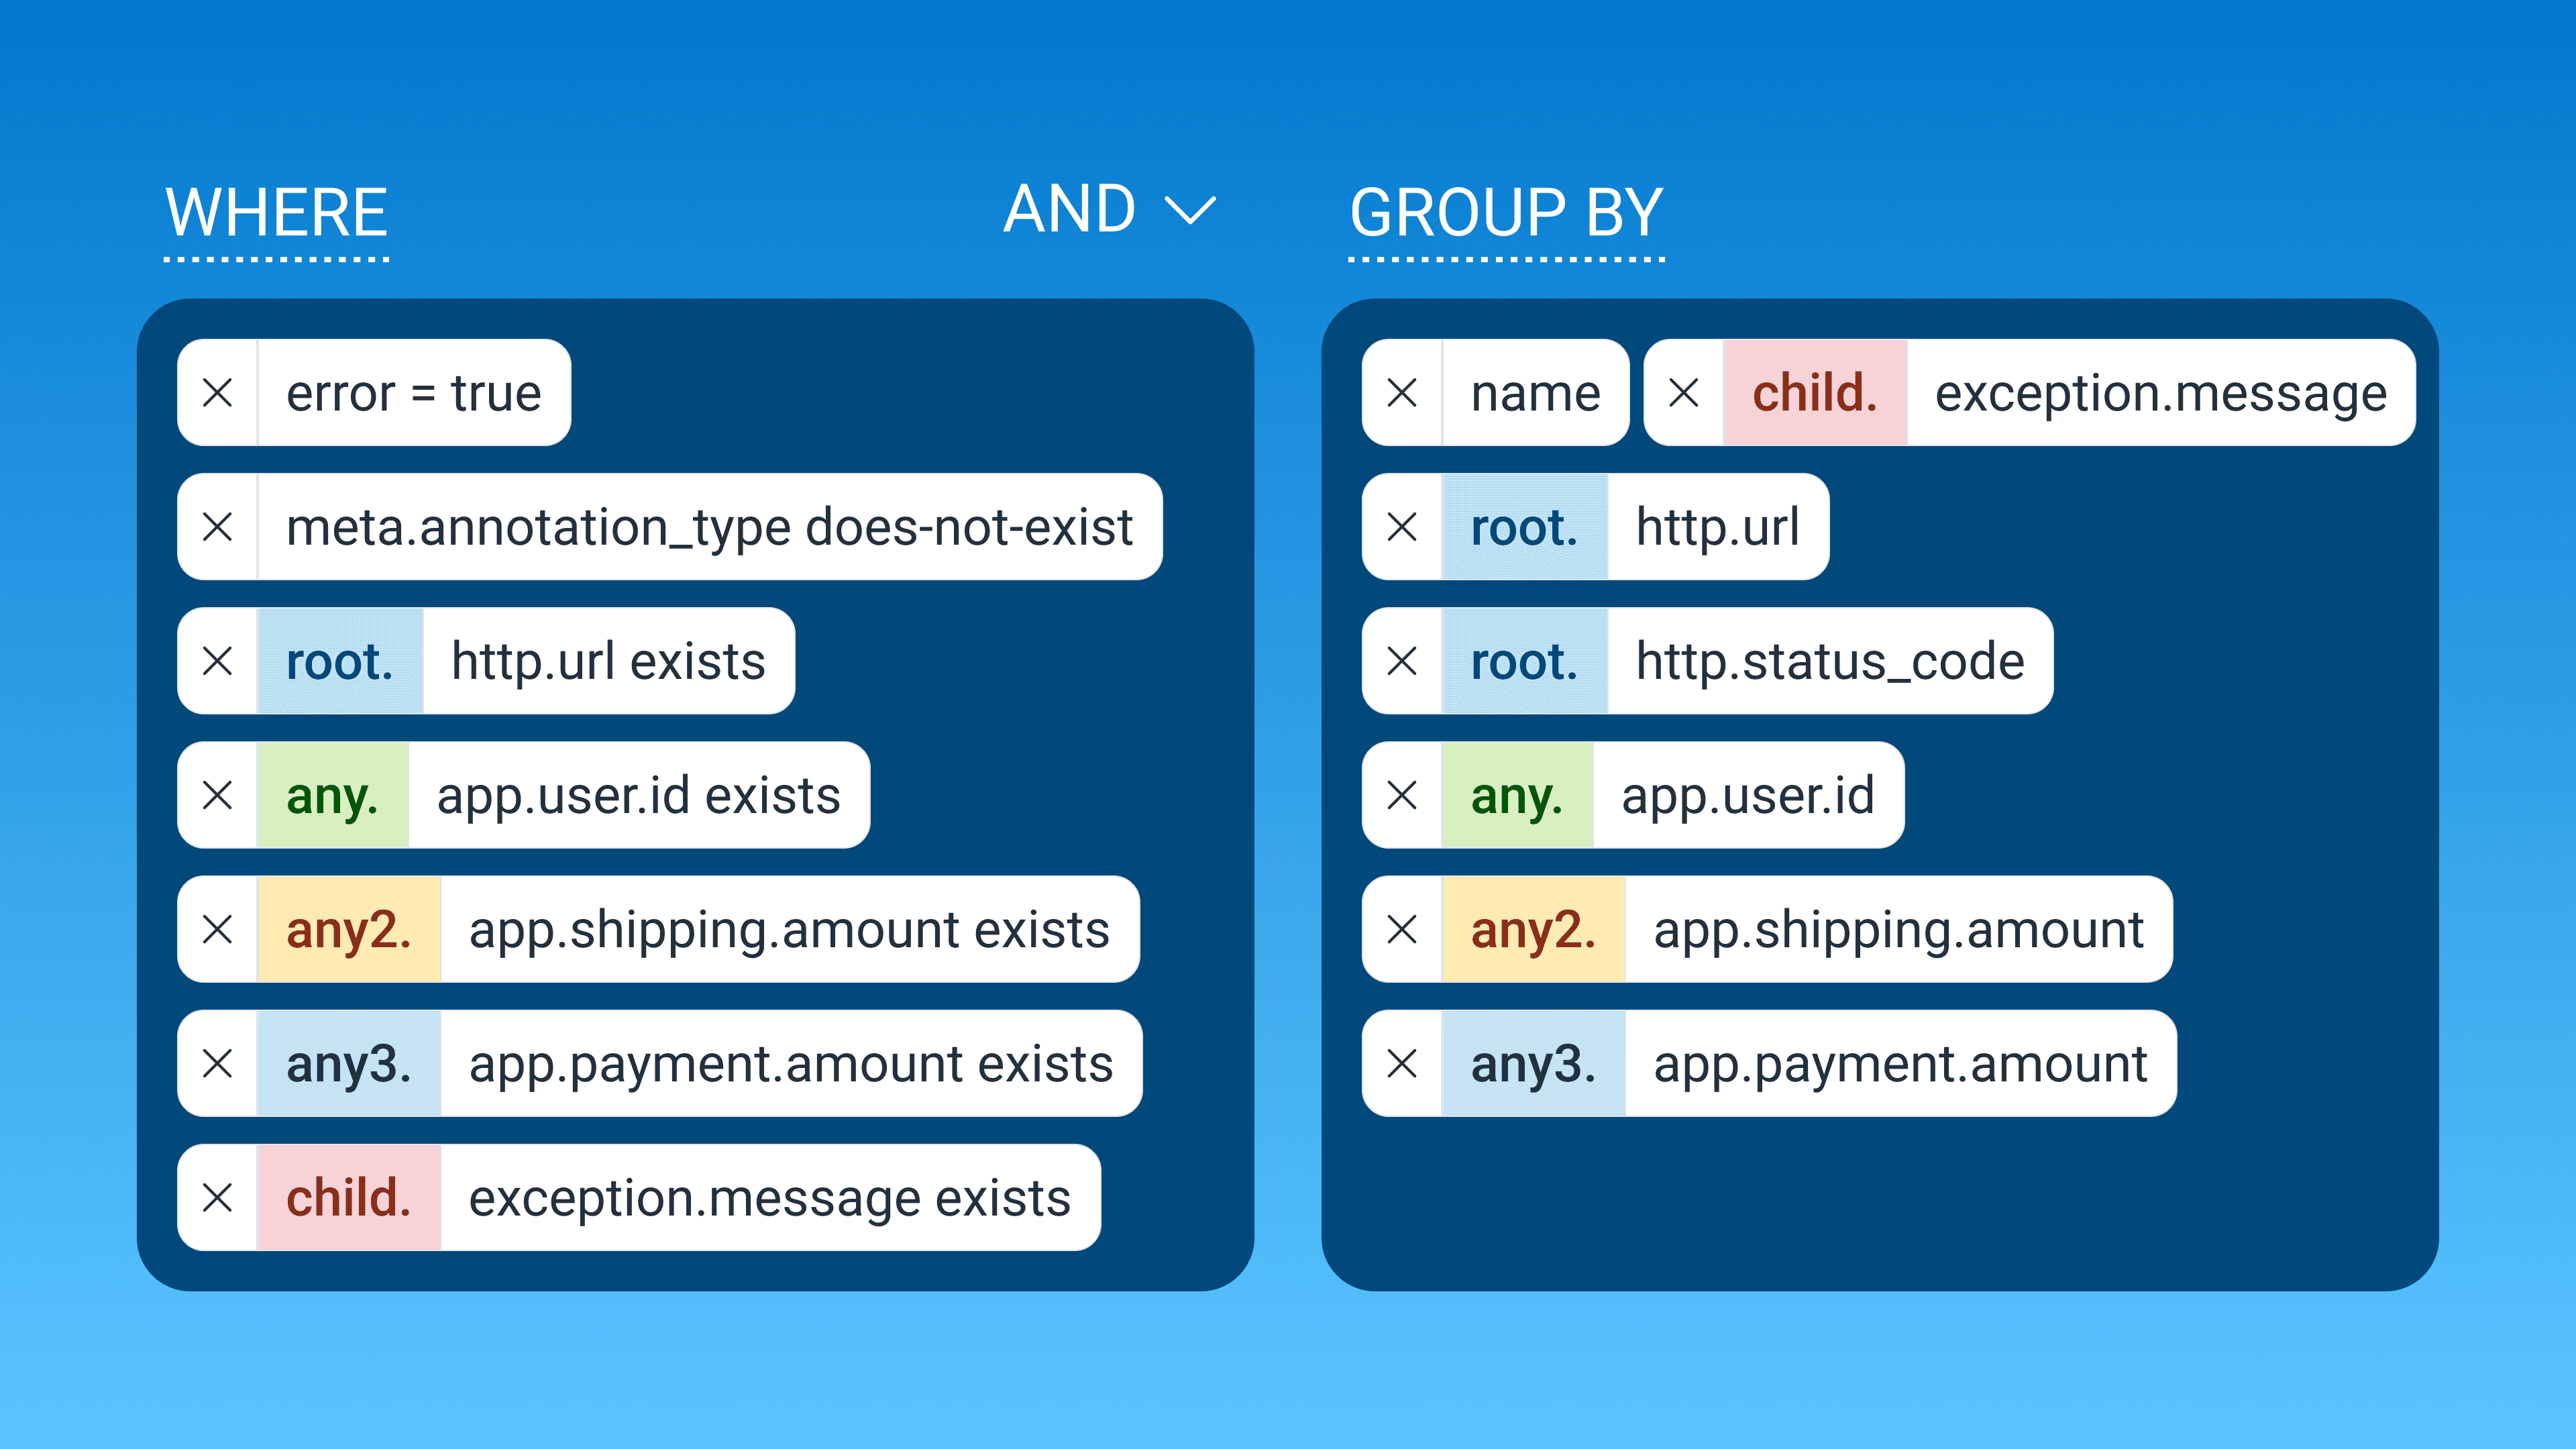
See how Honeycomb's relational query keywords—root, parent, child, any, any2, any3, and none—let you pull attributes from anywhere in a single trace into one query, walked through with a real checkout-error investigation.
Rox Williams
Mike Terhar
There are many vendors, Honeycomb included, where actions on the application can emit a web request that goes to another service for coordination or tracking purposes. Many vendors have pre-built integrations, but some have a fallback that says “Custom Webhook” or similar. If you’re looking to create a full picture of your request flow, you would want these other services to show up in your trace waterfall.
I want to know what users are doing in my application. A distributed trace is the best way to show the data flow of one user interaction through my application, but it isn’t sufficient to show the overall user experience.
Tyler Helmuth
We recently released Refinery 2.9, which came with great performance improvements. Reading through the release notes, I felt the need to write a piece on this improvement, as it’s quite important but easy to overlook: collect loop taking too long. This is the story of how we used distributed tracing to find the slowdown in this loop.
In the software space, we spend a lot of time defining the terminology that describes our roles, implementations, and ways of working. These terms help us share fundamental concepts that improve our software and let us better manage our software solutions. To optimize your software solutions and help you implement system observability, this blog post will share the key differences between two important terms: traces and logs.
Josephine Yuan
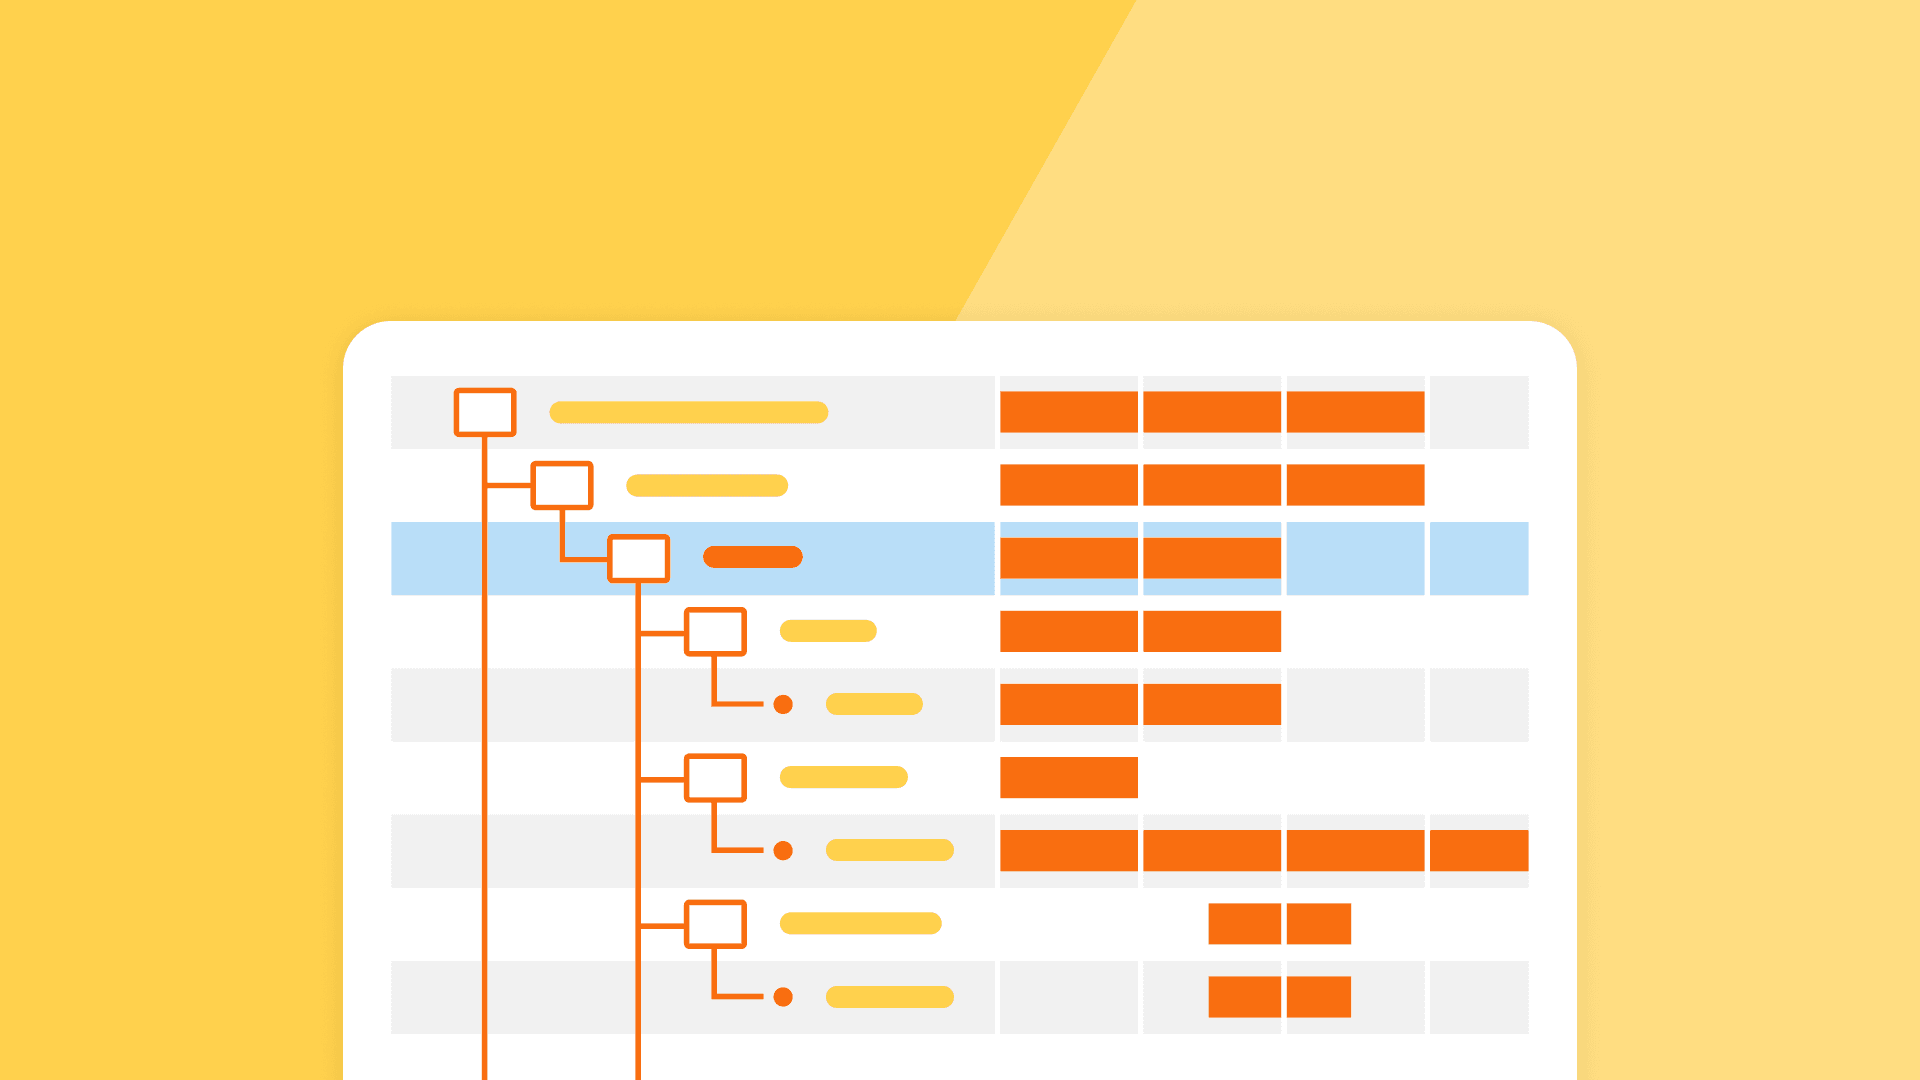
We recently introduced relational fields, a new feature that allows you to query spans based on their relationship to each other within a trace. This post identifies use cases that were previously impossible (or extremely difficult!) without these relational fields.
Honeycomb is massively powerful at delivering detailed answers from the last several weeks of system telemetry within seconds. It keeps you in the flow state needed to work through complex system failures while asking question after question to get closer to the answer. The biggest trade-off is the 60 day retention limit.
Martin Thwaites
One of the issues with the W3C trace context is that it doesn’t define any standards for how far a trace is to propagate. If a third party accidentally sends trace headers from their service, you’ll use their trace IDs and baggage data. This can have unwanted affects on your telemetry backend, such as the trace showing missing root spans, or including multiple API calls in a single trace at the top level. This makes understanding and debugging trace data hard. Worse though, the baggage data from the third party could contain PII data, which would therefore mean you’re processing PII without realizing it.
OpenTelemetry and Beelines were designed with assumptions about the types of traffic that most users would trace. Based on these assumptions, web application and API calls fit very nicely into a trace waterfall view. This is also the set of assumptions for Refinery, our sampling proxy, to manage the traces it processes. These assumptions are true for most traffic.
Nir Gazit
At Traceloop, we’re solving the single thing engineers hate most: writing tests for their code. More specifically, writing tests for complex systems with lots of side effects, such as this imaginary one, which is still a lot simpler than most architectures I’ve seen.
Dear Miss O11y, I remember reading quite interesting opinions from you about usage of metrics and traces in an application. Did you elaborate on those points in a blog post somewhere, so I can read your arguments to forge some advice for myself? I must admit that I was quite puzzled by your stance regarding the (un)usefulness of metrics compared to traces in apps in some contexts (debugging).
So you’re used to debugging systems using a distributed trace, but your system is about to introduce a message queue—and that will work the same… right? Unfortunately, in a lot of implementations, this isn’t the case. In this post, we’ll talk about trace propagation (manual and OpenTelemetry), W3C tracing, and also where a trace might start and finish.
Rebecca Carter
Distributed tracing enables you to monitor and observe requests as they flow through your distributed systems to understand whether these requests are behaving properly. You can compare tiny differences between multiple traces coming through your microservices-based applications every day to pinpoint areas that are affecting performance. As a result, debugging and troubleshooting are simpler and faster. No one has to guess or spend countless hours researching possible causes for issues, like you would if traditional logging methods were your only resource.
Nick Rycar
We’re here to show you three ways you can jumpstart a distributed tracing effort, starting small and expanding as it makes sense. These examples involve only a little code and perhaps a bit of a mindset change. Starting small with distributed tracing can even be fun, because who doesn’t like getting customized results without much work?
Jessica Kerr (Jessitron)
In the social world, there is no outside: we participate in the systems we study. I’ve noticed this in code: when I come to an existing codebase, I get a handle on it by changing stuff. Change some text to “HELLO JESS” and see it on the screen. Break something on purpose and see what fails. Refactor and find compilation errors. After I make some real changes and shepherd them into production, then I’m integrated with the code, I come to an understanding of it.
Liz Fong-Jones
Dear Miss O11y, How is modern observability using tracing, such as Honeycomb, different from the previous distributed tracing software I’m familiar with, like Dapper, at my company? I haven’t really been able to wrap…
Miss O11y is delighted to welcome our newest band member: Martin Thwaites! Martin has been a member of the Honeycomb user community practically since its inception. He is a UK-based consultant who specializes in…
TL;DR: startSpan is easier and measures a duration. Use it if your work won’t create any subspans. startActiveSpan requires that you pass a callback for the work in the span, and then any spans…