See how your apps, services and experiences connect.
Let AI explore production data to resolve issues faster.
Understand agent behavior, performance and cost in production.
Collect, control and route telemetry across your stack.
Maintain reliability and efficiency at enterprise scale.
Explore solutions for specific engineering challenges.
The industries and company sizes Honeycomb supports.
Connect Honeycomb with the technologies across your stack.
See how Honeycomb improves your business and engineering outcomes.
See how teams use Honeycomb to achieve measurable results.
Understand how Honeycomb differs from other approaches.
Ken Rimple
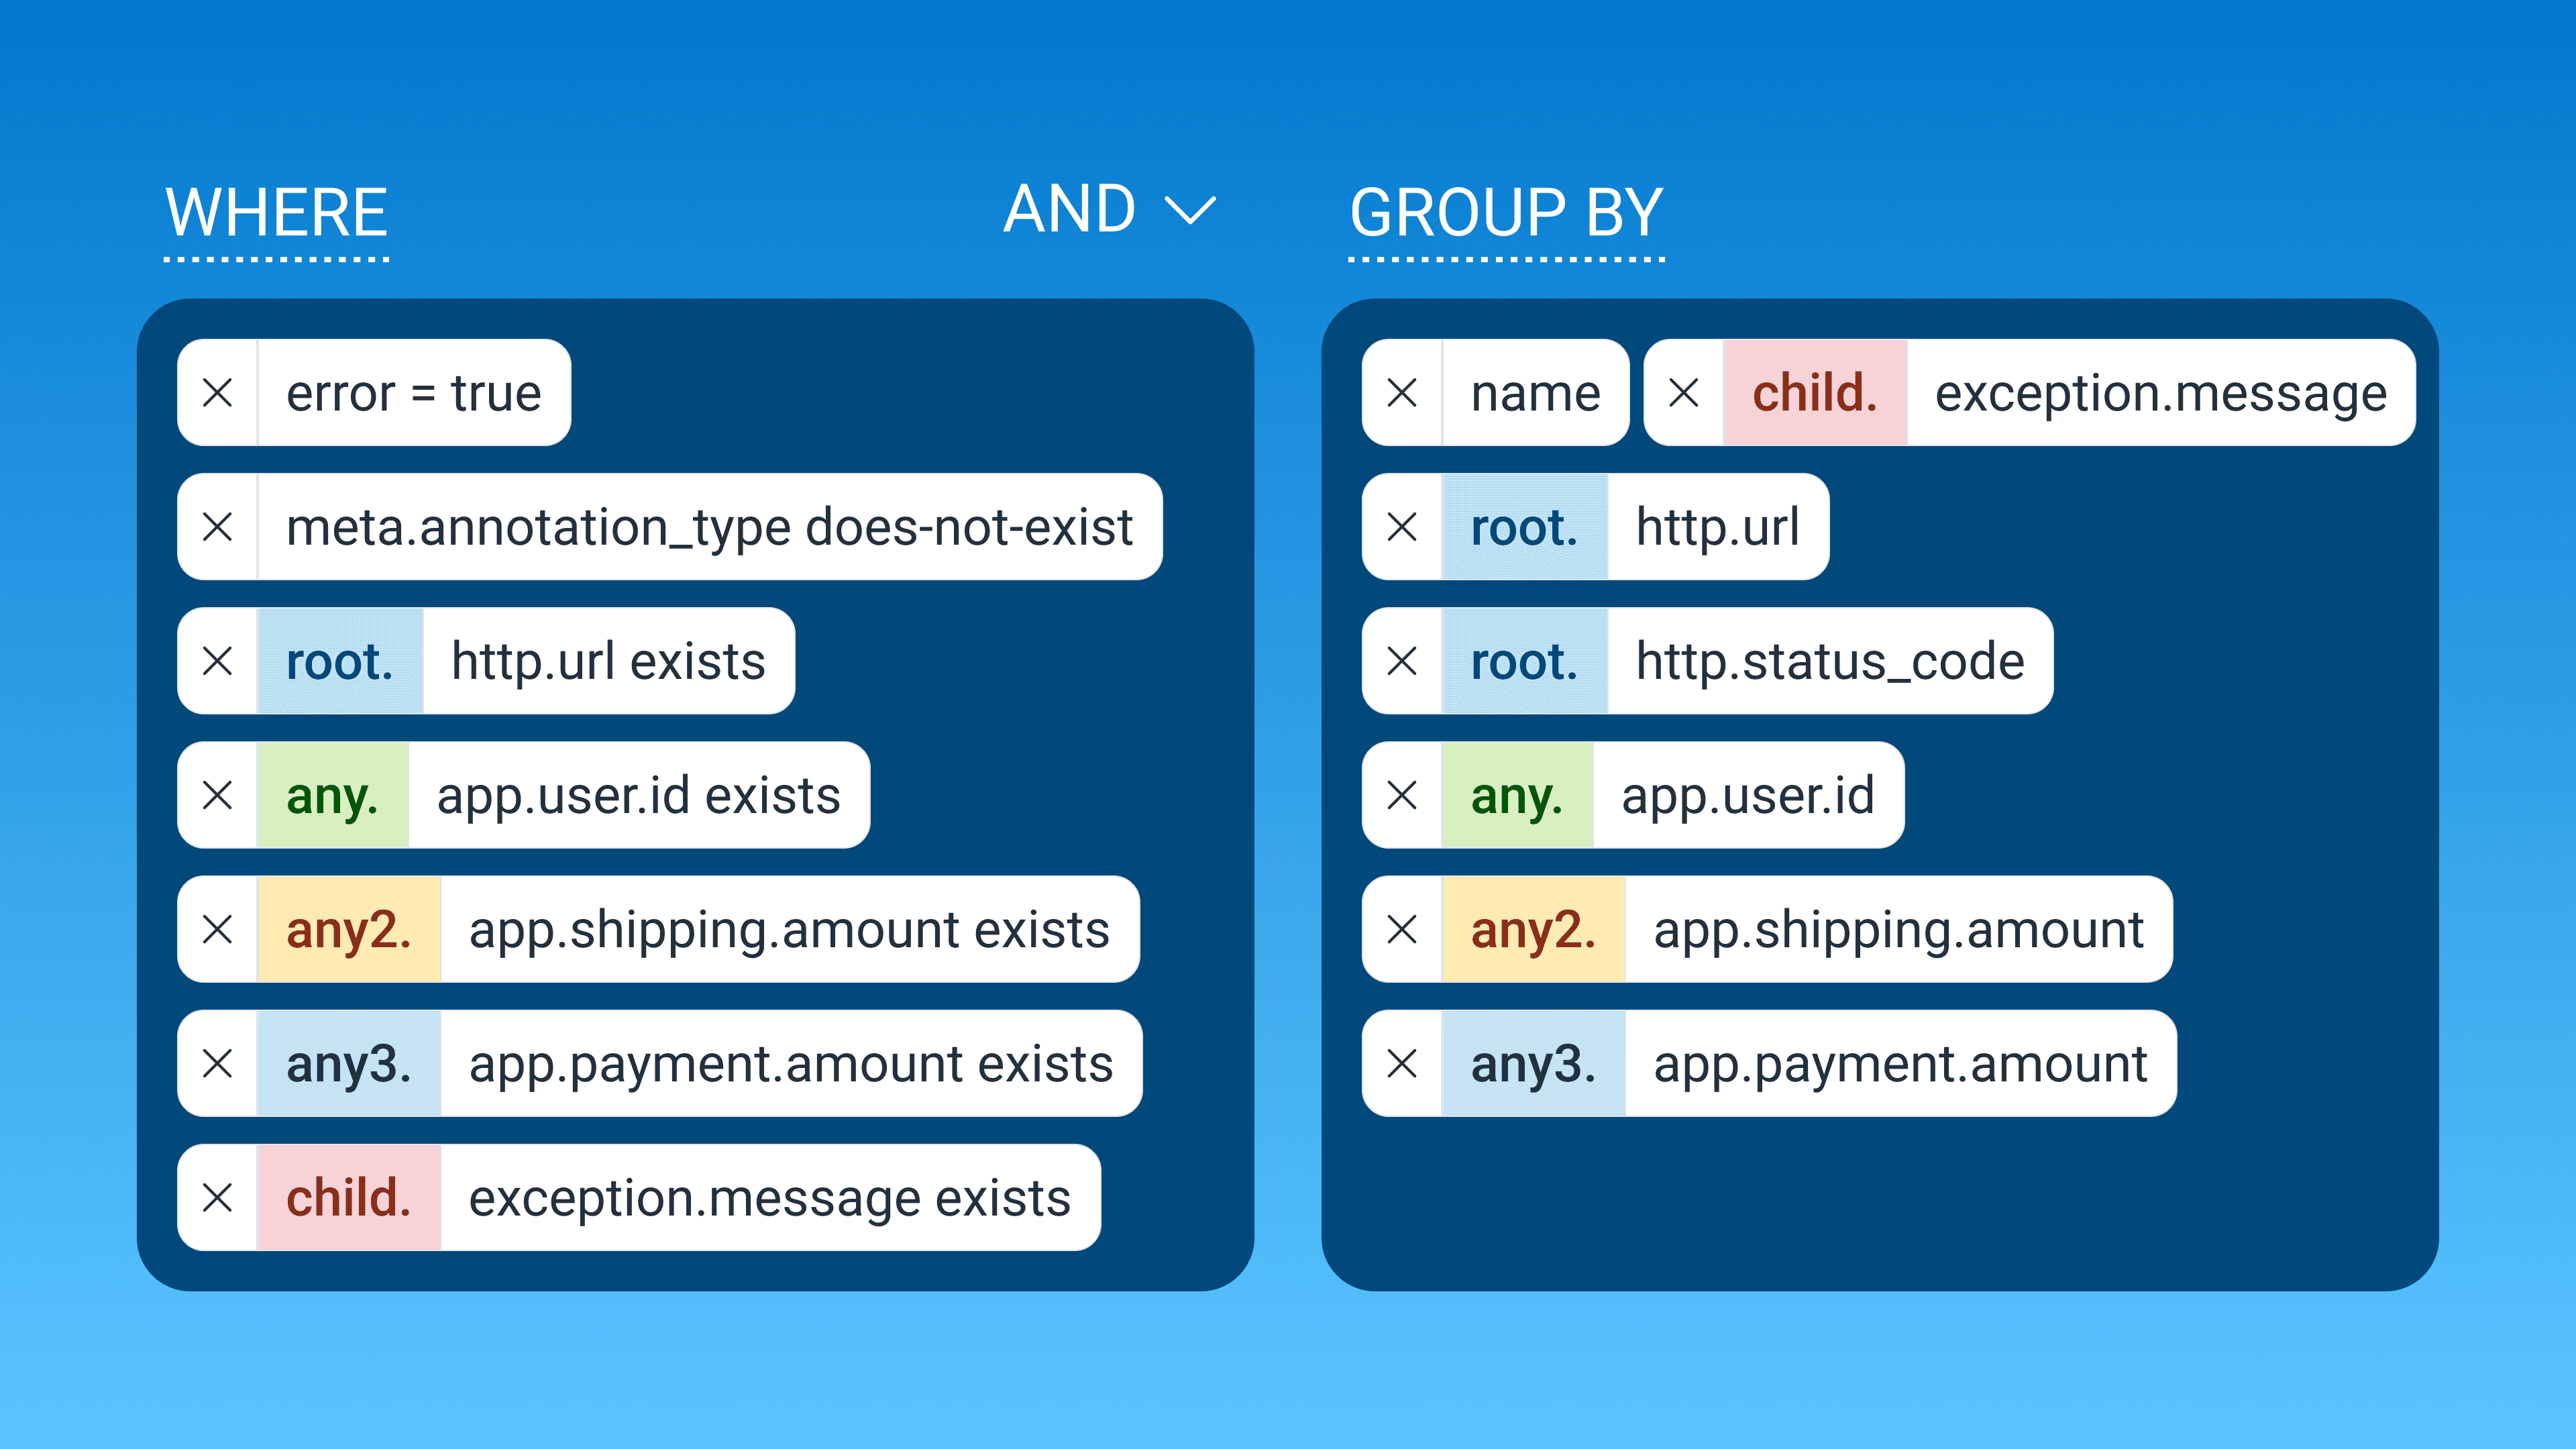
See how Honeycomb's relational query keywords—root, parent, child, any, any2, any3, and none—let you pull attributes from anywhere in a single trace into one query, walked through with a real checkout-error investigation.
Martin Thwaites
The Collector is the focal point for telemetry inside your cluster. Instead of your containerized applications sending directly to your OpenTelemetry-capable backend (the place that allows you to ask questions of your telemetry), we send that data to an internal location first, then forward the data on.
Josephine Yuan
We recently introduced relational fields, a new feature that allows you to query spans based on their relationship to each other within a trace. This post identifies use cases that were previously impossible (or extremely difficult!) without these relational fields.
George Miranda
If you’re writing software today, then you likely use a CI/CD pipeline to build and test your code before deploying it to production. Having a fast and efficient build pipeline saves you development time, shortens feedback loops, and helps you ship features faster. Conversely, slow and unreliable build pipelines are full of lost productivity and sadness.
If you build or maintain code in GitHub, the Honeycomb Buildevents Action can help you optimize the performance of your build pipelines in GitHub Actions. This blog introduces you to the gha-buildevents Action and a new hands-on quickstart guide that will show you the inner workings of GitHub Actions workflows, the buildevents tool, and the Honeycomb UI.
Google’s Core Web Vitals (CWV) are used to rank the performance of mobile sites or pages. It’s easy to see when your CWV scores are low, but it’s not always clear exactly why that’s happening. In Honeycomb’s new guide, Tracking Core Web Vitals with Honeycomb and Vercel, you can learn how to capture, analyze, and debug your real-world CWV performance using a free Honeycomb account.
Brian Langbecker
“How do I get started on instrumentation with OpenTelemetry, while also following best practices for the long-term?” This article is all about taking you from A to Z on instrumentation. Learn how to create immediate observability and see traces in your application right away, without changing code—and more!
More often than not, as developers, when we get a report that a large customer is hitting 500 errors, there’s a flurry of activity. What’s wrong? Is something deeply broken? So you start digging…
Phillip Carter
OpenTelemetry (or “OTel”) helps you get your instrumentation started quickly, and it helps you get the most out of that telemetry data by providing flexible exporting options.
Danyel Fisher
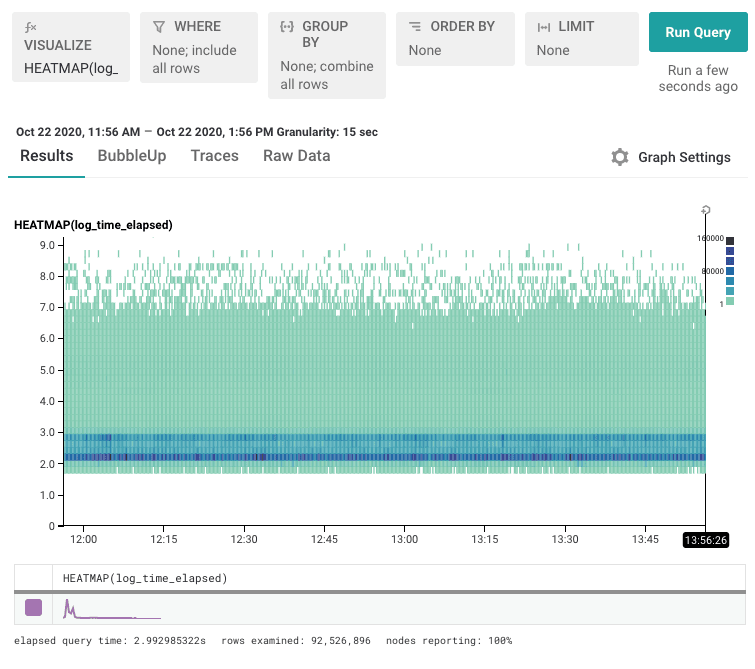
We often say that Honeycomb helps you find a needle in your haystack. But how exactly is that done? This post walks you through when and how to visualize your data with heatmaps, creating a log scale to surface data you might otherwise miss, and using BubbleUp to quickly discover the patterns behind why certain data points are different.