Honeycomb was built for the AI era. Learn how to futureproof your software for what comes next.
Discover why Honeycomb is the better choice for your engineers, your customers, and your bottom line.
Start your journey with the definitive guide to observability. Download our complimentary ebook.
Bring observability to every software engineer.
Learn about our company, mission and values.
Come for the impact, stay for the culture.
See Honeycomb's latest press releases, media, and more
Learn more about becoming a Honeycomb partner.
Already a Honeycomb customer?
Charity Majors
We’ve been talking about observability 2.0 a lot lately; what it means for telemetry and instrumentation, its practices and sociotechnical implications, and the dramatically different shape of its cost model. With all of these details swimming about, I’m afraid we’re already starting to lose sight of what matters. The distinction between observability 1.0 and observability 2.0 is not a laundry list, it’s not marketing speak, and it’s not that complicated or hard to understand. The distinction is a technical one, and it’s actually quite simple.
Jessica Kerr (Jessitron)
Oh no, I’m getting out-of-memory errors! How much memory is my app using? To find out, we go look for a metric that tells us how much memory is available, and we graph it around the time that our errors occurred.
Kent Quirk
Refinery is Honeycomb’s sampling proxy, which our largest customers use to improve the value they get from their telemetry. It has a variety of interesting samplers to choose from. One category of these is called dynamic sampling. It’s basically a technique for adjusting sample rates to account for the volume of incoming data—but doing so in a way that rare events get more priority than common events.
Nick Travaglini
At this point, it’s almost passé to write a blog post comparing events to the three pillars. Nobody really wants to give up their position. Regardless, I’m going to talk about how great events are and use some analogies to try to get that across. Maybe these will help folks learn to really appreciate them and to depreciate a certain understanding of the three pillars. Or maybe not.
In 2016, we at Honeycomb first borrowed the term “observability” from the wikipedia entry for control systems observability, where it is a measure of your ability to understand internal system states just by observing its outputs. We then spent a couple of years trying to work out how that definition might apply to software systems. Many twitter threads, podcasts, blog posts, and lengthy laundry lists of technical criteria emerged from that work, including a whole ass book.
Brian Chang
Engineering has come a long way since the days of delivering discrete, point-in-time products that were often packaged on a CD and shipped to customers. The days of physical media and long development cycles are long gone. The advent of cloud computing and the rise of Software-as-a-Service (SaaS) transformed the landscape, creating a new model of continuous development and service delivery. This shift has not only revolutionized how software is developed, but has also redefined the engineer’s role.
Rox Williams
Simply put, full-stack observability is monitoring designed for modern, cloud-native architectures. It allows you to understand how your software system interacts at scale, across everything from traditional mainframes and legacy clients to modern serverless or Kubernetes-based services.
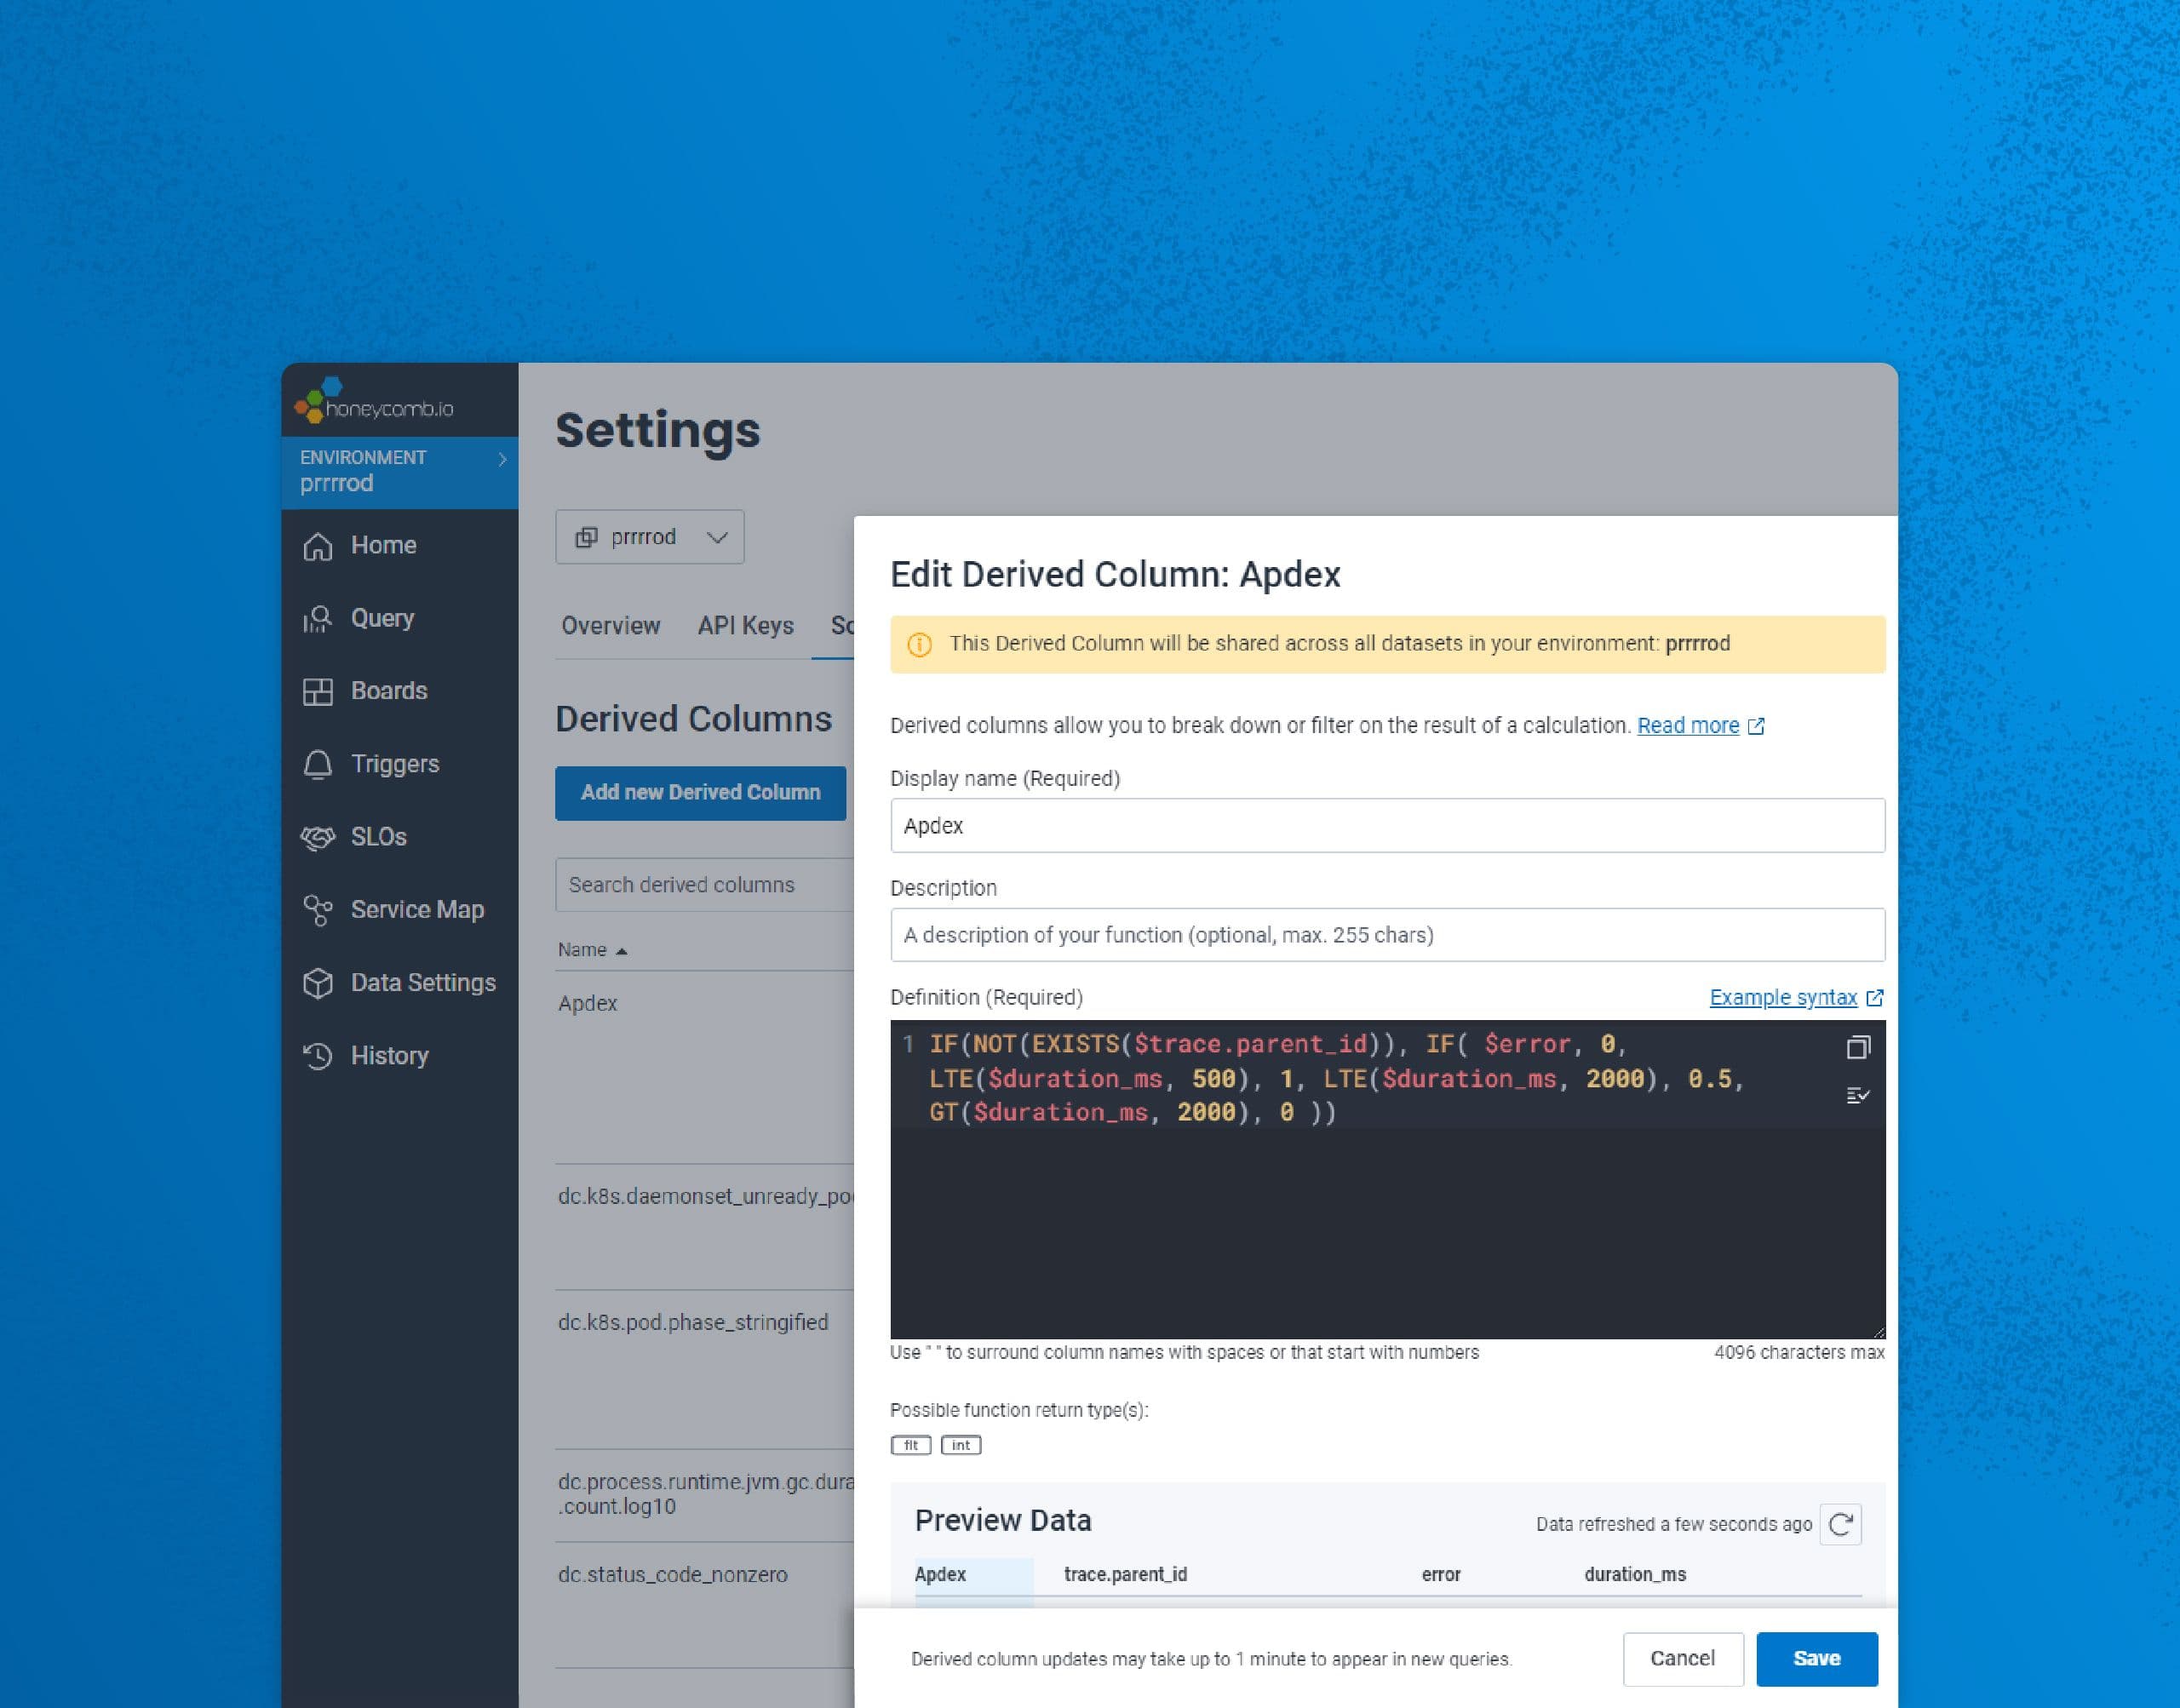
Max Aguirre
“How is my app performing?” is one of the most common, yet hardest questions to answer. There are myriad ways to measure this, like error rate, average response time, and so on. Enter the Application Performance Index (aka Apdex), a single metric that attempts to answer, “Are my application’s users happy?”
In the not-too-distant past, building software was relatively straightforward. The simplicity of LAMP stacks, Rails, and other well-defined web frameworks provided a stable foundation. Issues were isolated, systems failed in predictable ways, and engineers had time to innovate on new features for the business. And it was good.
Liz Fong-Jones
Everyone’s talking about “observability,” but many don’t know what it is, what it’s for, or what benefits it offers. With this framing of observability in terms of goals instead of tools, we hope teams will have better language for improving what their organization delivers and how they deliver it.
Jessica Nunn
Earlier this year, Honeycomb announced the launch of data residency in Europe. To meet the growing needs of our customers in the region, we are delighted to announce new Honeycomb Support business hours.
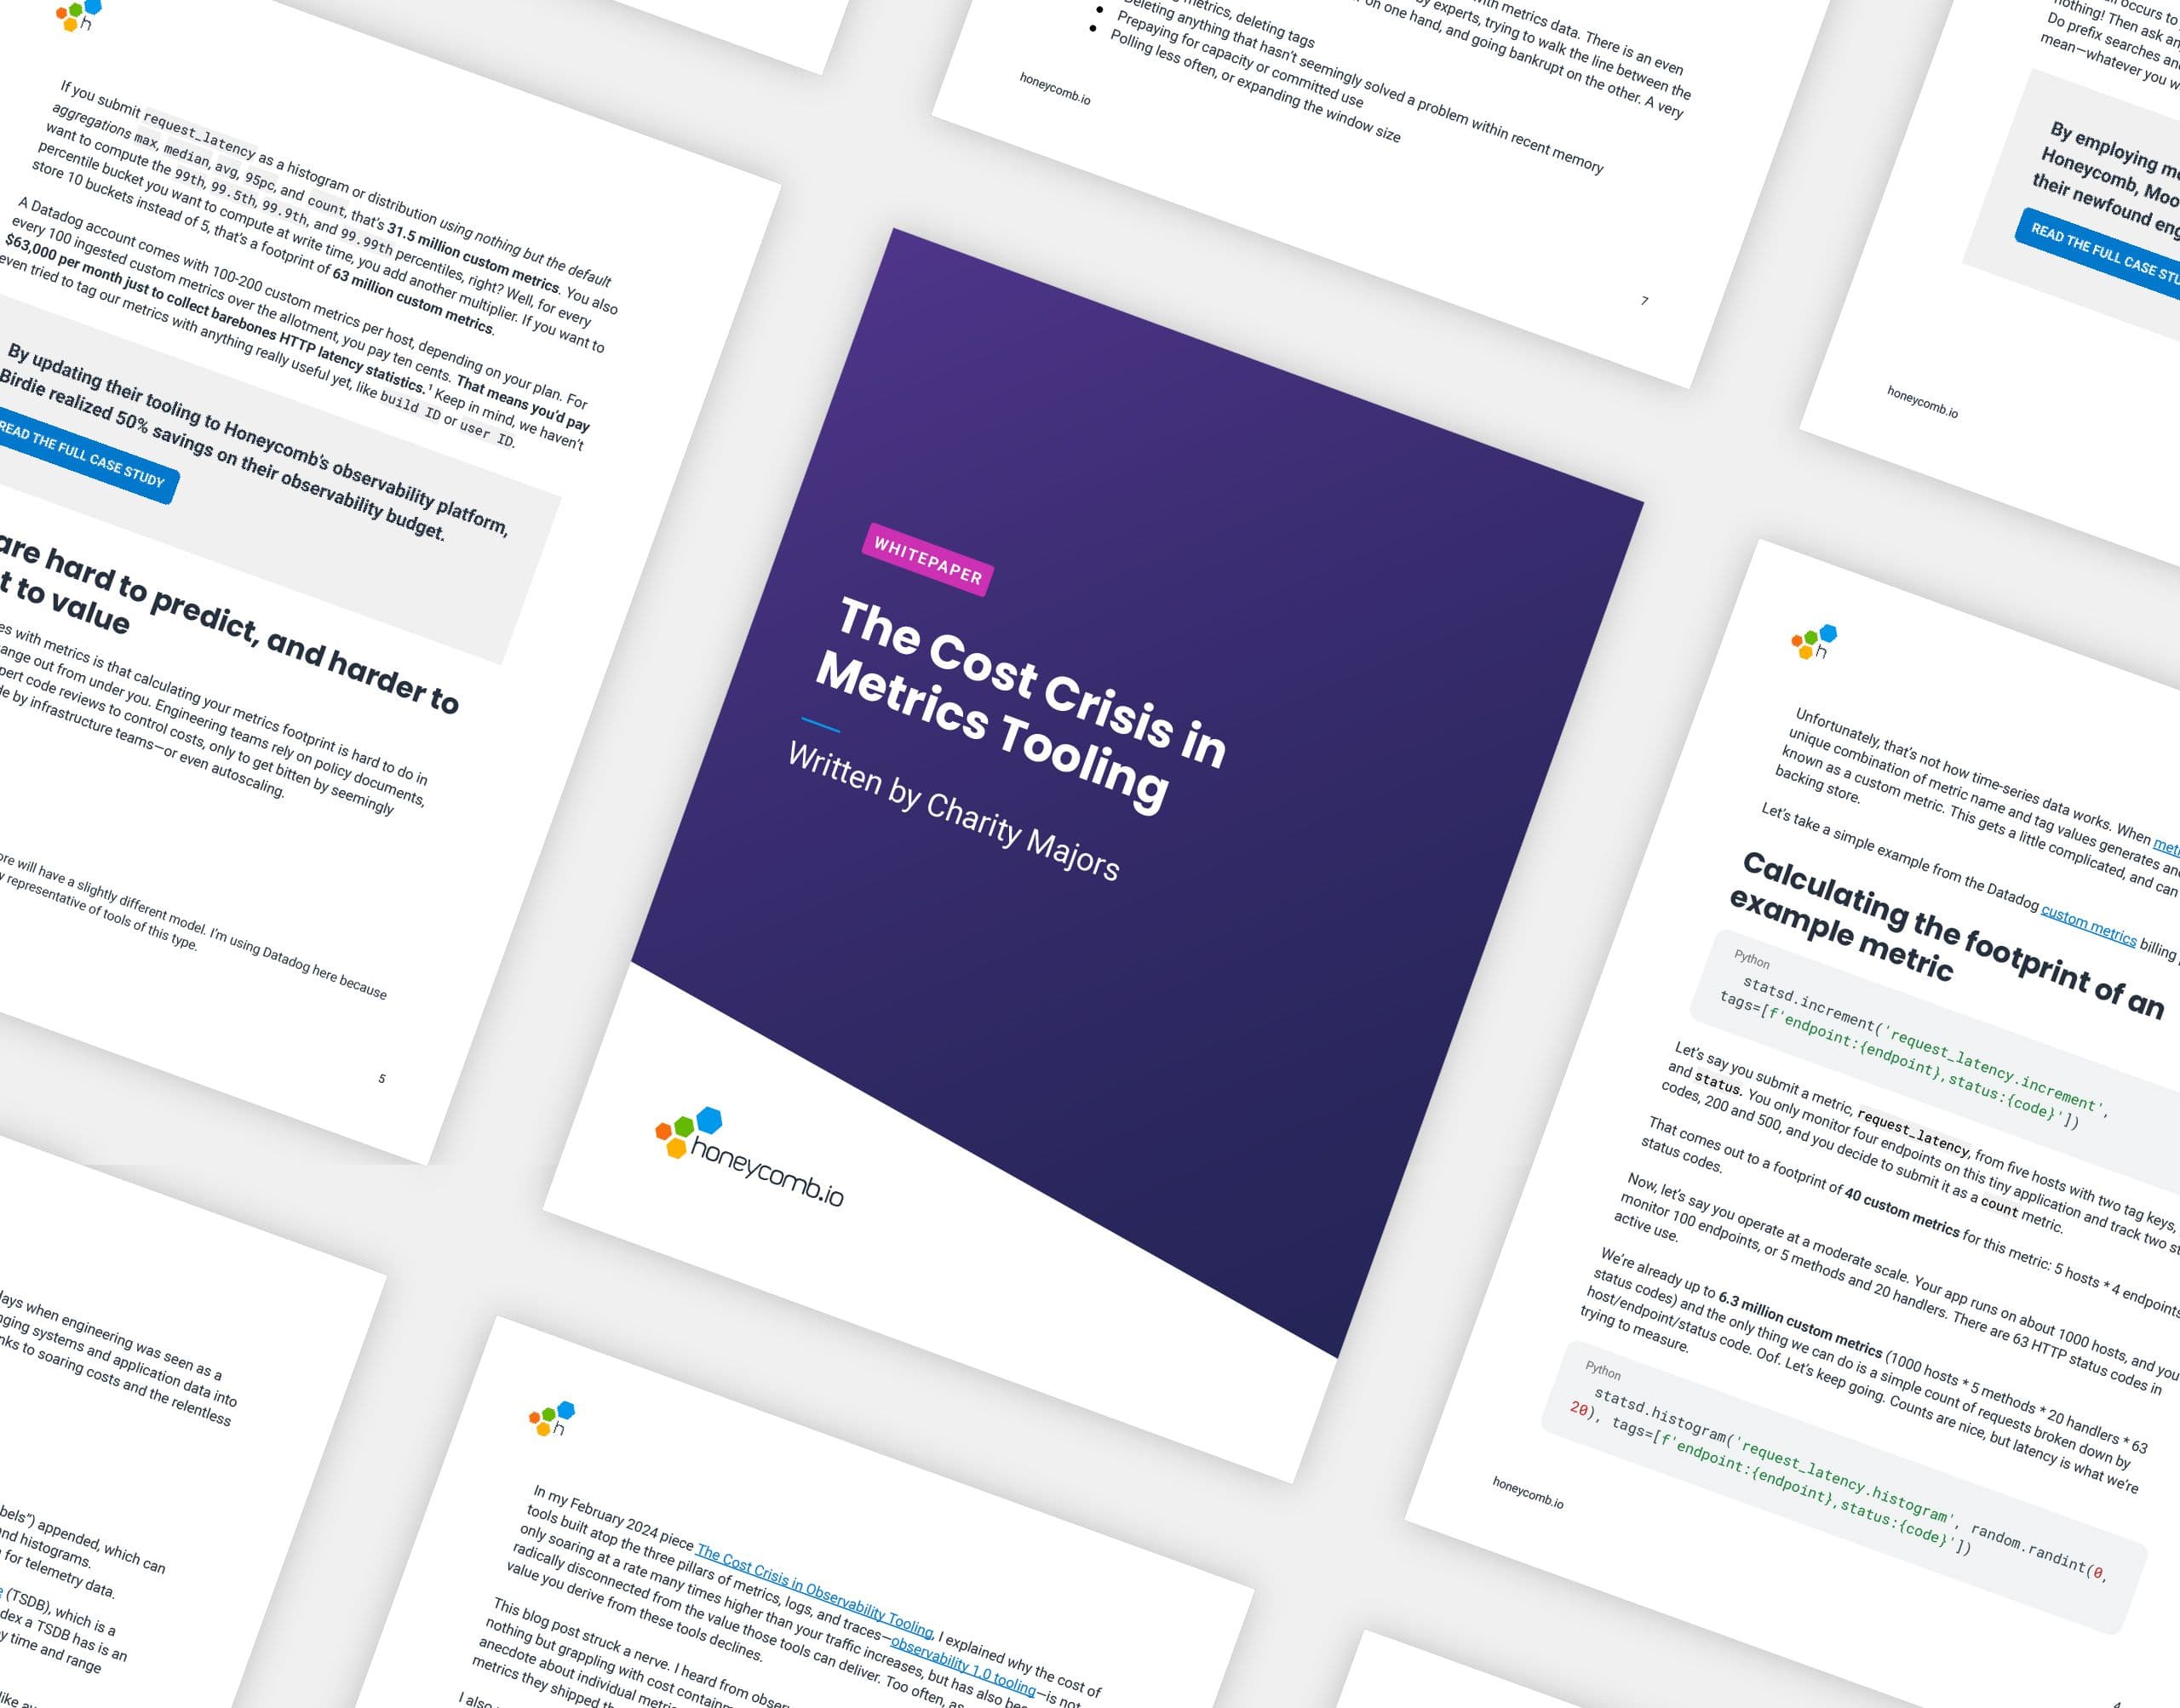
In my February 2024 piece The Cost Crisis in Observability Tooling, I explained why the cost of tools built atop the three pillars of metrics, logs, and traces—observability 1.0 tooling—is not only soaring at a rate many times higher than your traffic increases, but has also become radically disconnected from the value those tools can deliver. Too often, as costs go up, the value you derive from these tools declines.
Get it delivered straight to your inbox.
By subscribing to our newsletter, you agree to Honeycomb’s Terms of Service and Privacy Notice.
Over the past five years, software and systems have become increasingly complex and challenging for teams to understand. Simply understanding what’s broken is difficult enough, but trying to do so while balancing the need to constantly innovate and ship makes the problem worse. Your end users have options, and if your software systems are unreliable, they’ll choose a different one.
Winston Hearn
Honeycomb for Frontend Observability gives frontend developers the ability to quickly identify opportunities for optimization within their web app. This starts with better OpenTelemetry instrumentation, available as an NPM package, that lets you instrument and collect attribution data on Core Web Vitals in under an hour.
Austin Parker
You’re probably familiar with the concept of real user monitoring (RUM) and how it’s used to monitor websites or mobile applications. If not, here’s the short version: RUM requires telemetry data, which is generated by an SDK that you import into your web or mobile application. These SDKs then hook into the JS runtime, the browser itself, or various system APIs in order to measure performance. These SDKs are usually pretty optimized for both speed and size—you don’t want the dependency that tells you how fast or slow your application is to impact your application speed, after all.
Today at Google Next, Charity Majors demonstrated how to use Honeycomb to find unexpected problems in our generative AI integration. Software components that integrate with AI products like Google’s Gemini are powerful in their ability to surprise us. Nondeterministic behavior means there is no such thing as “fully tested.” Never has there been more of a need for testing in production!
Purvi Kanal
In a previous blog post, we outlined how to set up our own auto-instrumentation to send Core Web Vitals data to Honeycomb. We recently released a beta version of an OpenTelemetry wrapper to send traces from the browser to Honeycomb.
There’s a sentence that strikes fear into the heart of every frontend developer I’ve ever met: Users are reporting issues, and we don’t know how to replicate them. What do you do when that happens? Do you cry? Do you mark the issue as wontfix and move on? Personally, I took the road less traveled: gave up frontend engineering and moved into product management (this is not actually accurate but it’s a good joke and it feels truthy).
Kate Guarente-Smith
We’re excited to unveil a new collaboration with Focused Labs, a leap forward in our shared commitment to advancing modern observability practices and enhancing the robustness of legacy systems. This partnership is not just about scaling our service offerings but also about integrating Focused Labs’ deep engineering expertise with our observability platform to deliver unparalleled customer experiences.
In twenty years of software development, I did not have the privilege of being on call, of tending to my software in production. I’ve never understood what “APM” means. Anybody can tell me what it stands for—Application Performance Monitoring (or sometimes, the M means Management)—but what does it mean? What do people use APM for? Now, I work at an observability company—and still, no one can give me a satisfying definition of “APM.” So I did some research, and now the use of APM makes sense from a few angles.