Blog
Meet the Author
Danyel Fisher
Author
Explore Author's Blog
October 27, 2020
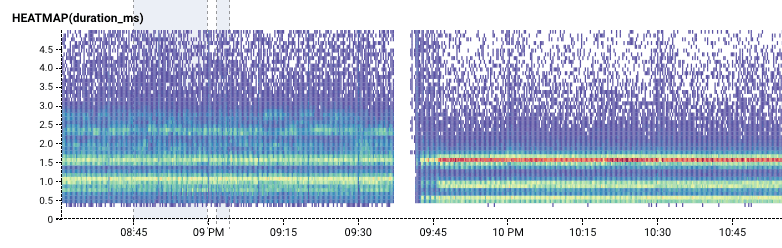
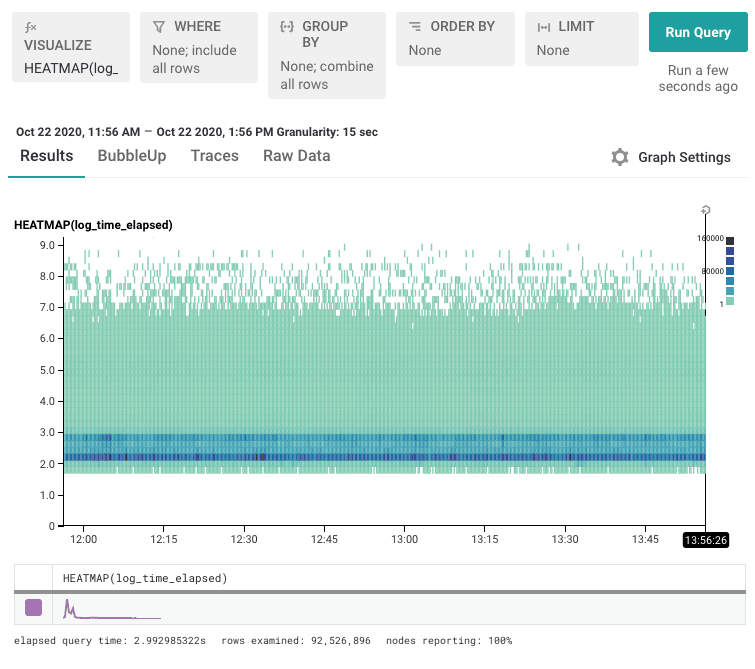
Handle Unruly Outliers with Log Scale Heatmaps
We often say that Honeycomb helps you find a needle in your haystack. But how exactly is that done? This post walks you through when and how to visualize your data with heatmaps, creating a log scale to surface data you might otherwise miss, and using BubbleUp to quickly discover the patterns behind why certain data points are different.