Honeycomb was built for the AI era. Learn how to futureproof your software for what comes next.
Discover why Honeycomb is the better choice for your engineers, your customers, and your bottom line.
Start your journey with the definitive guide to observability. Download our complimentary ebook.
Bring observability to every software engineer.
Learn about our company, mission and values.
Come for the impact, stay for the culture.
See Honeycomb's latest press releases, media, and more
Learn more about becoming a Honeycomb partner.
Already a Honeycomb customer?
Irving Popovetsky
Colin Burke
Austin Parker
In a really broad sense, the history of observability tools over the past couple of decades have been about a pretty simple concept: how do we make terabytes of heterogeneous telemetry data comprehensible to human beings?
We recently had the privilege of hosting several industry experts and technology executives across platform strategy, SRE, and engineering enablement for breakfast at our Observability Day in London.
Martin Thwaites
Elsie Phillips
You shipped your latest release. You tested it on emulators, QA devices, and the latest OS versions. But now it’s live and running on thousands or millions of real devices, across a jungle of screen sizes, hardware specs, OS versions, and network conditions. A user reports a crash on an old Samsung device over 3G. Someone else complains the app feels “sluggish” after updating. You dig through logs. Rebuild test cases. Ping the backend team. Try to reproduce. Yet, still no answers.
Martin Holman
The HTTP Content-Security-Policy response header is used to control how the browser is allowed to load various content types. It is used to control which URLs, fonts, images, scripts, and more can be loaded…
Charity Majors
In last week’s piece, we talked about some of the factors that are driving costs up, both good and bad, and about whether your observability bill is (or should be) more of a cost center or an investment. In this piece, I’m going to talk more in depth about cost drivers and levers of control.
The idea that telemetry data needs to be managed, or needs a strategy, draws a lot of inspiration from the data world (as in, BI and Data Engineering). Your company most likely has a data team that manages the data warehouse(s), data pipelines, data sources, and reporting tools. These teams are also constantly balancing costs with their user and stakeholder needs, usability, data retention, granularity, etc. Sound familiar? That’s because if you’re working on observability data, these teams are at least several years ahead of you in addressing these tradeoffs and considerations—and can teach us quite a lot.
In 2018, I dashed off a punchy little blog post in which I observed that teams with good observability seemed to spend around ~20-30% of their infra bill to get it. I also noted this was based on absolutely no data, only my own experiences and a bunch of anecdotes, heavily weighted towards startups and the mid-market tech sector.
Observability is way more about software engineering than it is about operations. Operators are users of observability data for monitoring and alerting on systems. They’ll use that telemetry data to scale systems, or potentially debug the outside of applications. In contrast, software engineers are creators, designers, and users of observability data, and where they use that data is much wider than that of pure operators of production systems.
Mike Terhar
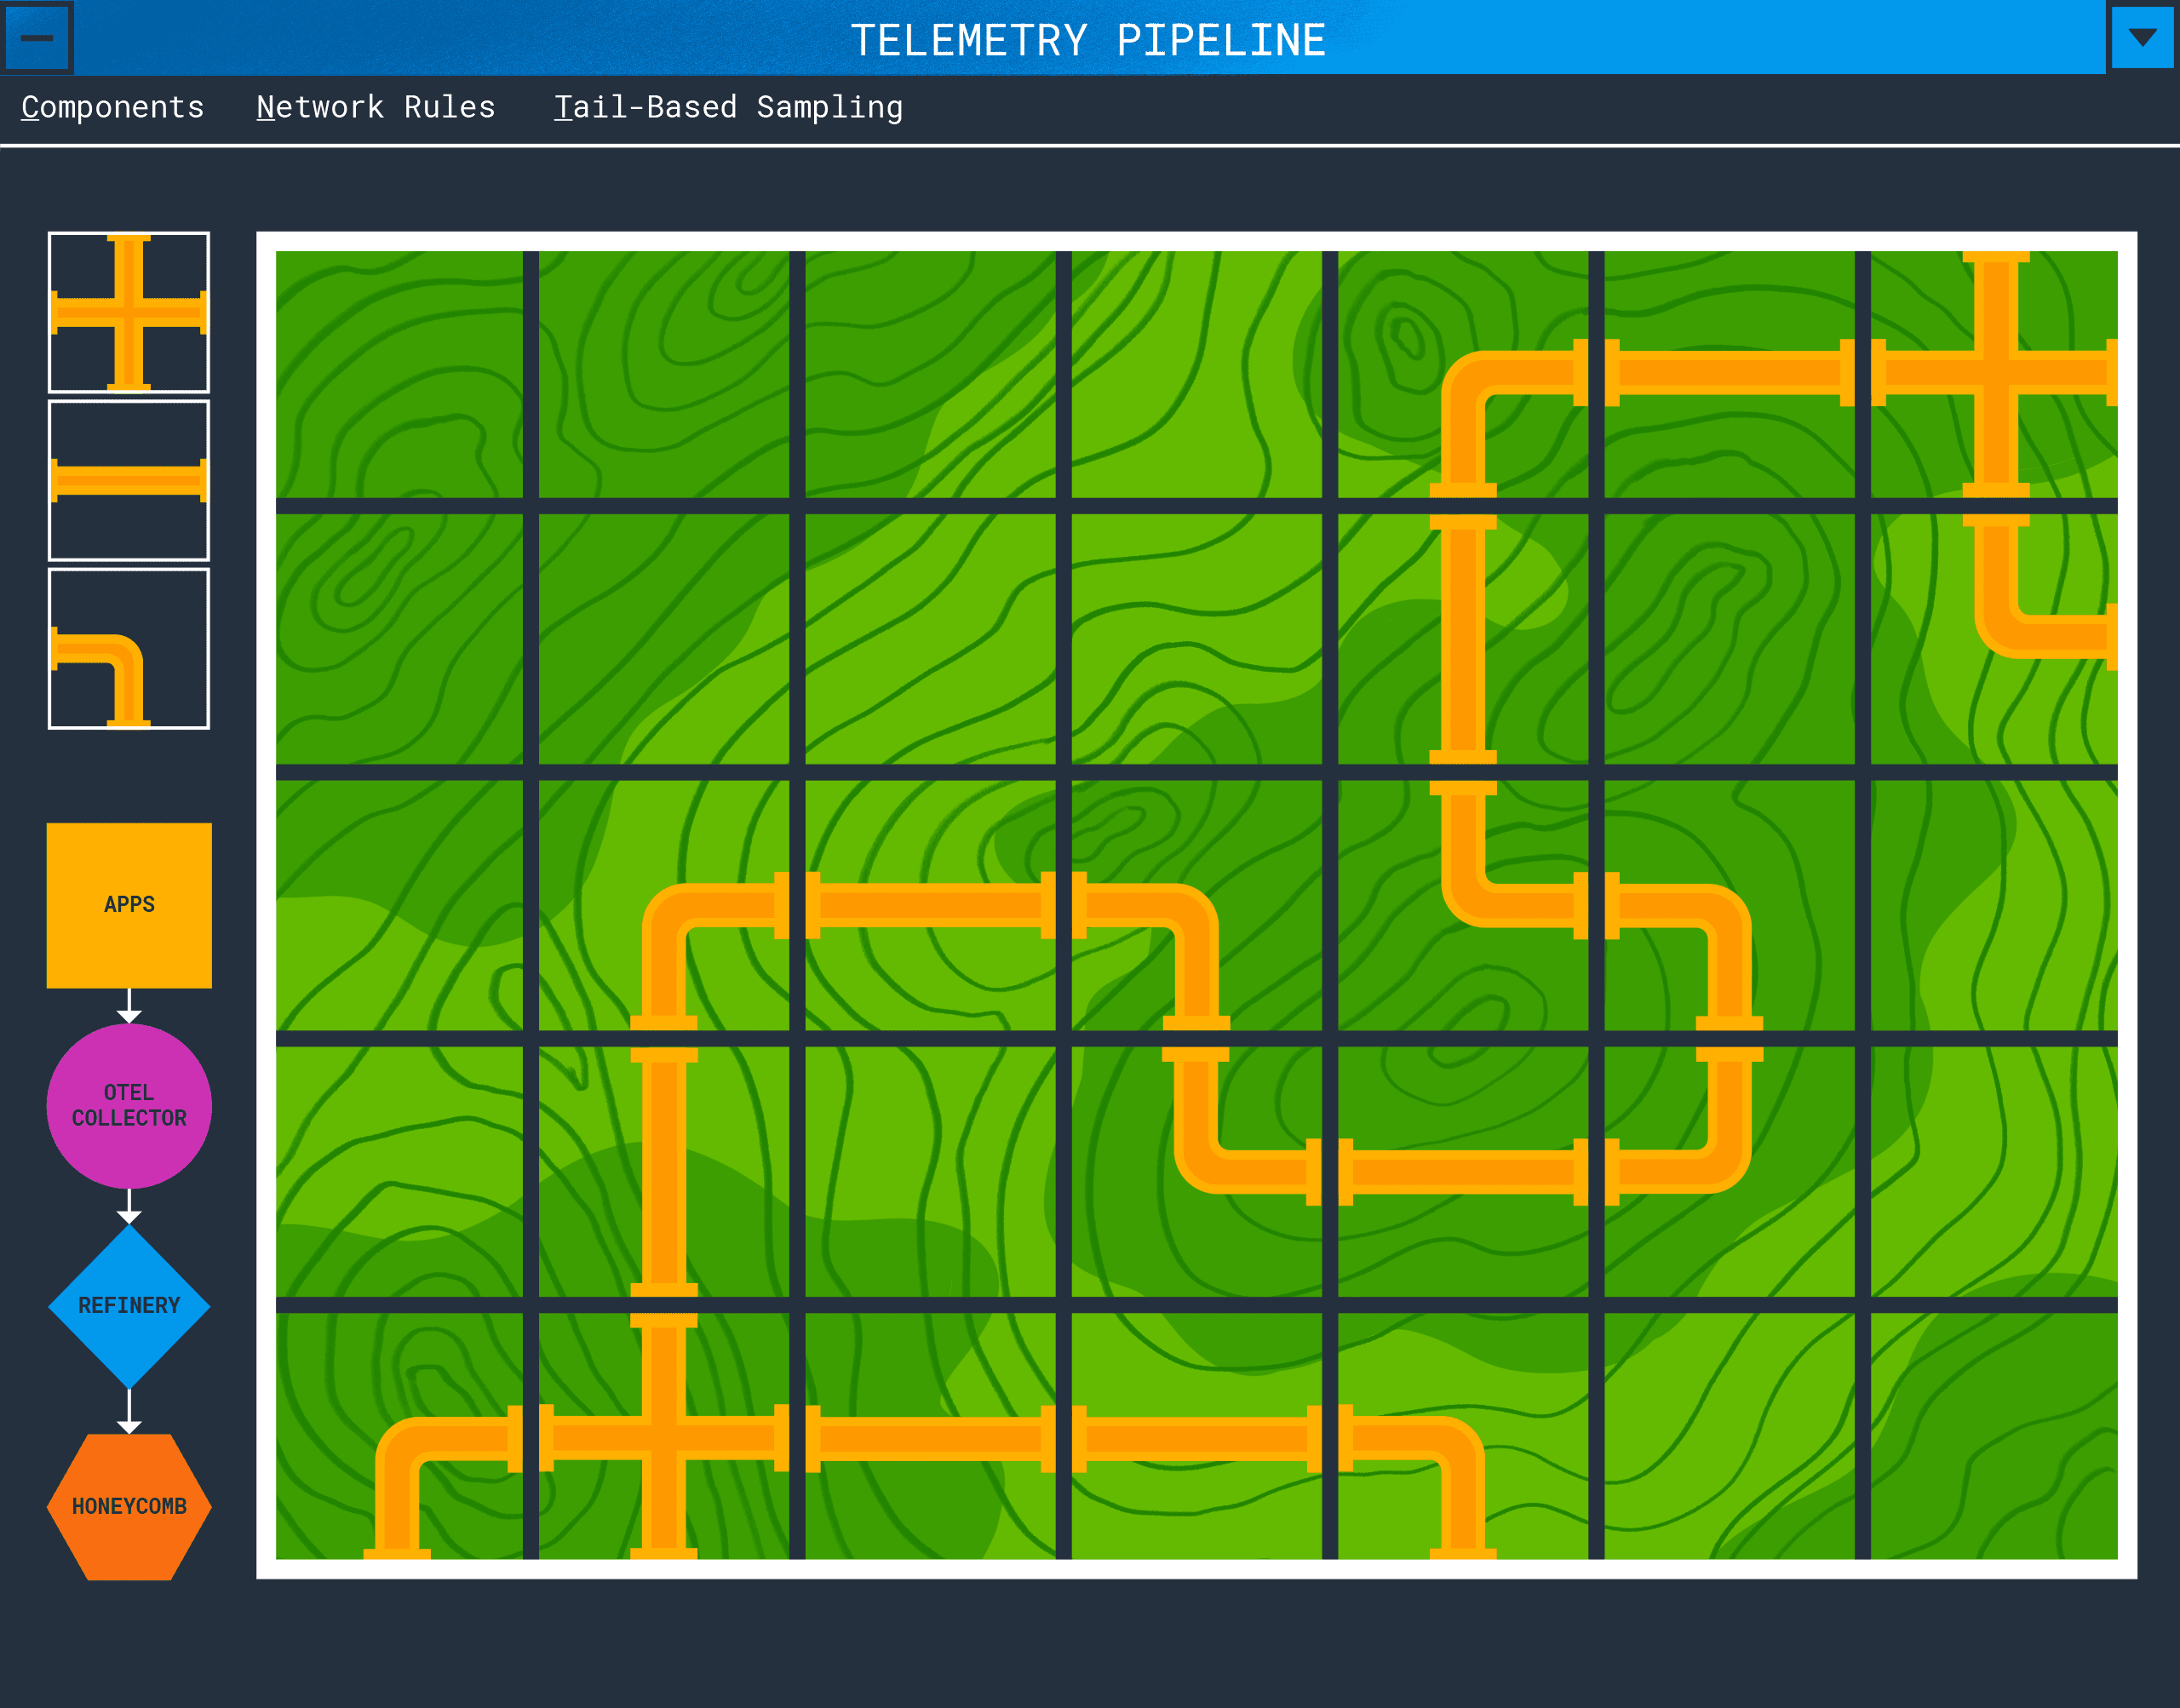
In a simple deployment, an application will emit spans, metrics, and logs which will be sent to api.honeycomb.io and show up in charts. This works for small projects and organizations that do not control outbound access from their servers. If your organization has more components, network rules, or requires tail-based sampling, you’ll need to create a telemetry pipeline.
Get it delivered straight to your inbox.
By subscribing to our newsletter, you agree to Honeycomb’s Terms of Service and Privacy Notice.
Grady Salzman
At Honeycomb, we’re actively growing our design system, Lattice, to ensure accessibility, optimize performance, and establish consistent design patterns across our product. One metric we use to measure Lattice is the adoption of components across the product. Adoption is about understanding how, where, and why they’re being used.
Observability and monitoring are not about gathering different data—they differ in their purpose, but share the same data.
Erwin van der Koogh
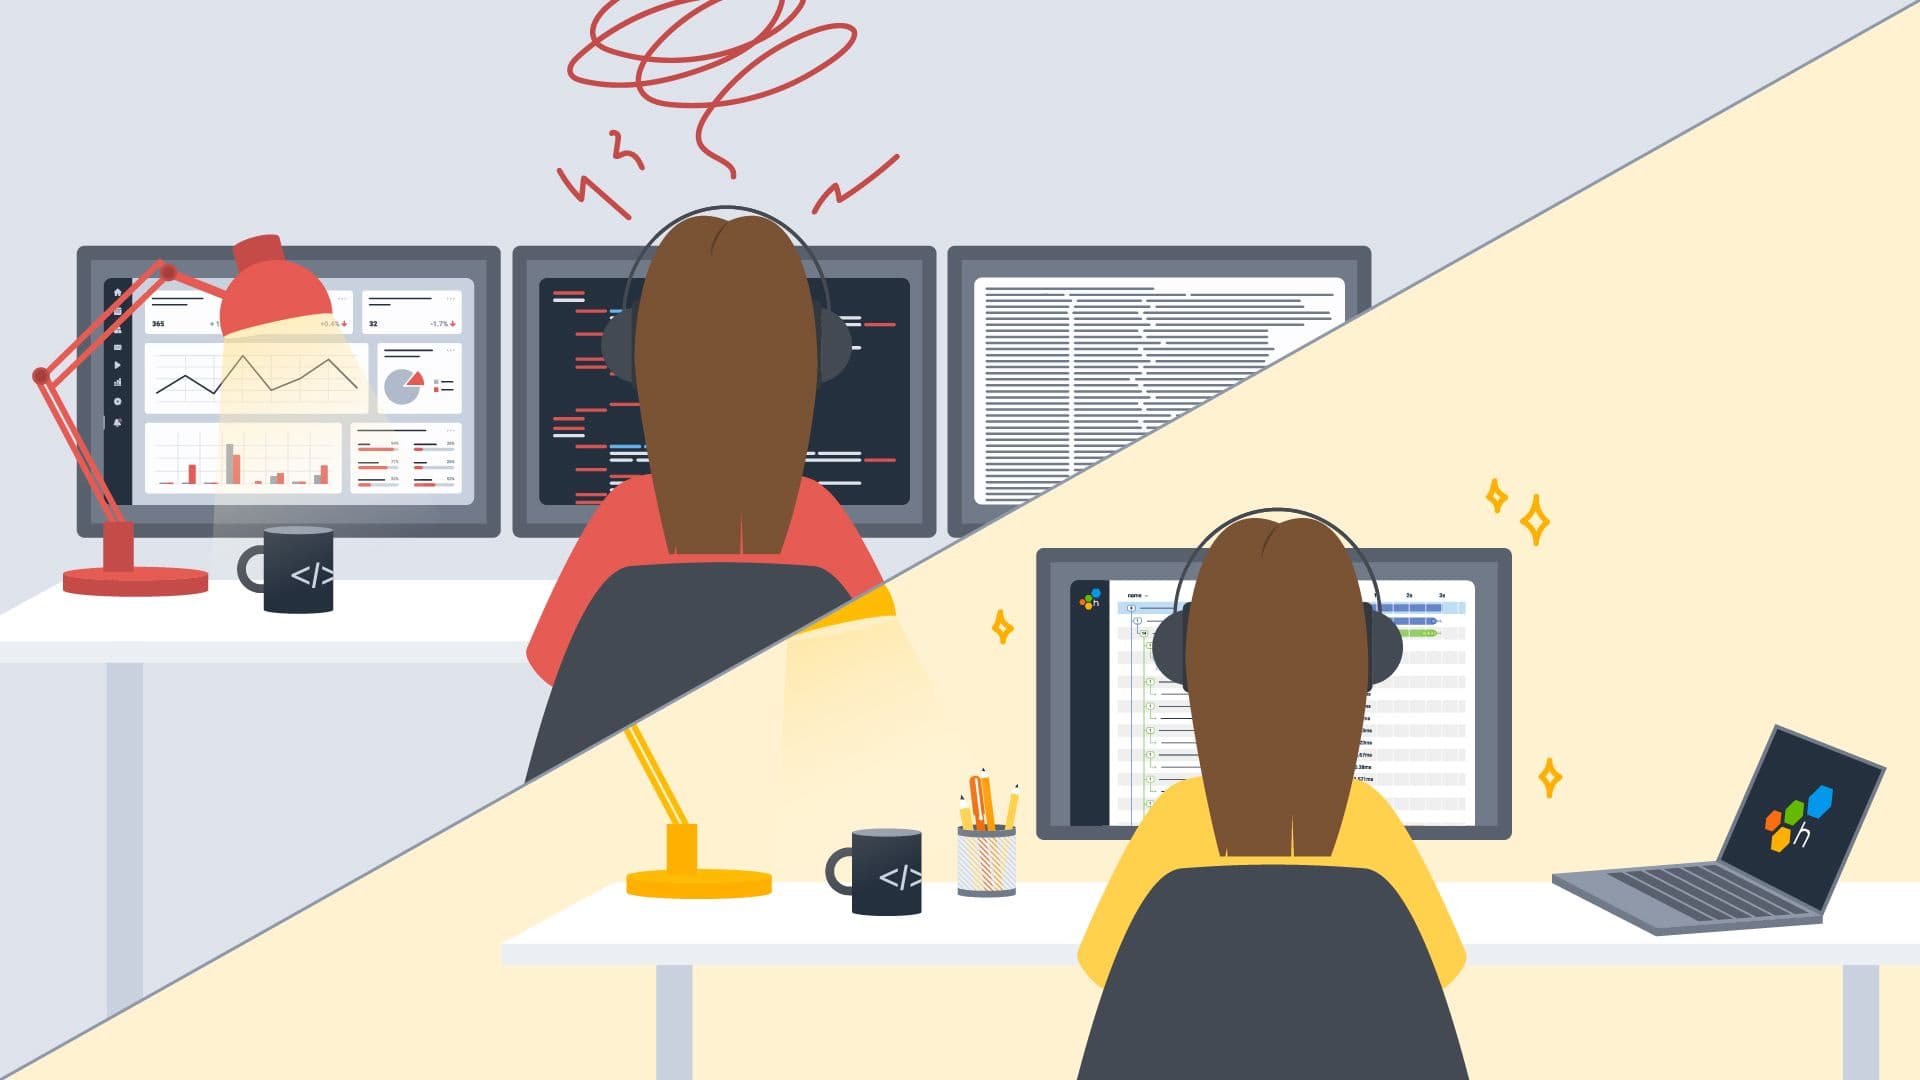
One of the hardest parts of my job is to get people to appreciate just how much of a difference Honeycomb/observability 2.0 is compared to their current way of working. It’s not just a small step up or a linear improvement. Rather, it’s an entire step change in the way that you write, deploy, and operate software for your customers.
Rox Williams
Another one in the history books: 2024 is (almost!) over. The OpenObservability Talks podcast, hosted by Dotan Horovits, recently featured a lively discussion with Charity Majors, Co-founder and CTO of Honeycomb, to reflect on the trends, achievements, and future of observability.
Jamie Danielson
Have you ever had an alert go off that you immediately ignore? It’s a nuisance alert—not actionable—but you keep it around just in case. Or maybe you’ve looked at a trace waterfall and wondered what exactly happened during a gap that just doesn’t drill down deep enough to explain what’s going on. Do you know the feeling where you have just enough information to monitor what’s going on in your systems, but not quite enough to put your mind at ease?
Honeycomb engineers were amongst the earliest adopters of this technology. Not in the widely parodied top-down, VP-mandated, “go be AI leaders nao plz” kind of way, but in a bottoms-up, experimental kind of way, driven by curiosity and fascination.
David Chang
Develocity, formerly known as Gradle Enterprise, is a powerful tool that speeds up local and CI build time, helps troubleshoot your builds, and analyzes your data. At Pinterest, we have a dedicated team, Mobile Builds, and we ensure that developers can build fast and often. This enables developers to be more productive by getting faster feedback on their code.
With more and often smaller processes, cloud-native architectures have driven the need for better insights into our software—a way to look into how these processes fit together. To accomplish this insight, we use an approach that goes beyond traditional monitoring and provides deep insights into system behavior. This approach is cloud observability.