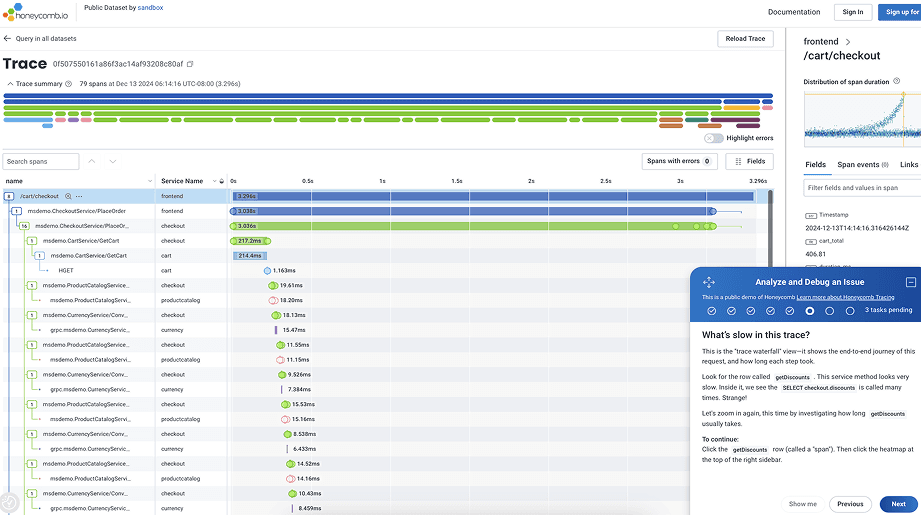
Rapid debugging with distributed tracing
Connect all your context within one tracing view for faster, clearer insights. Distributed tracing with Honeycomb gives you the full story of every request, whether it’s a checkout flow, a microservice call chain, or an LLM agent reasoning through a dozen tool calls.
Why you’ll love Honeycomb
See the whole picture
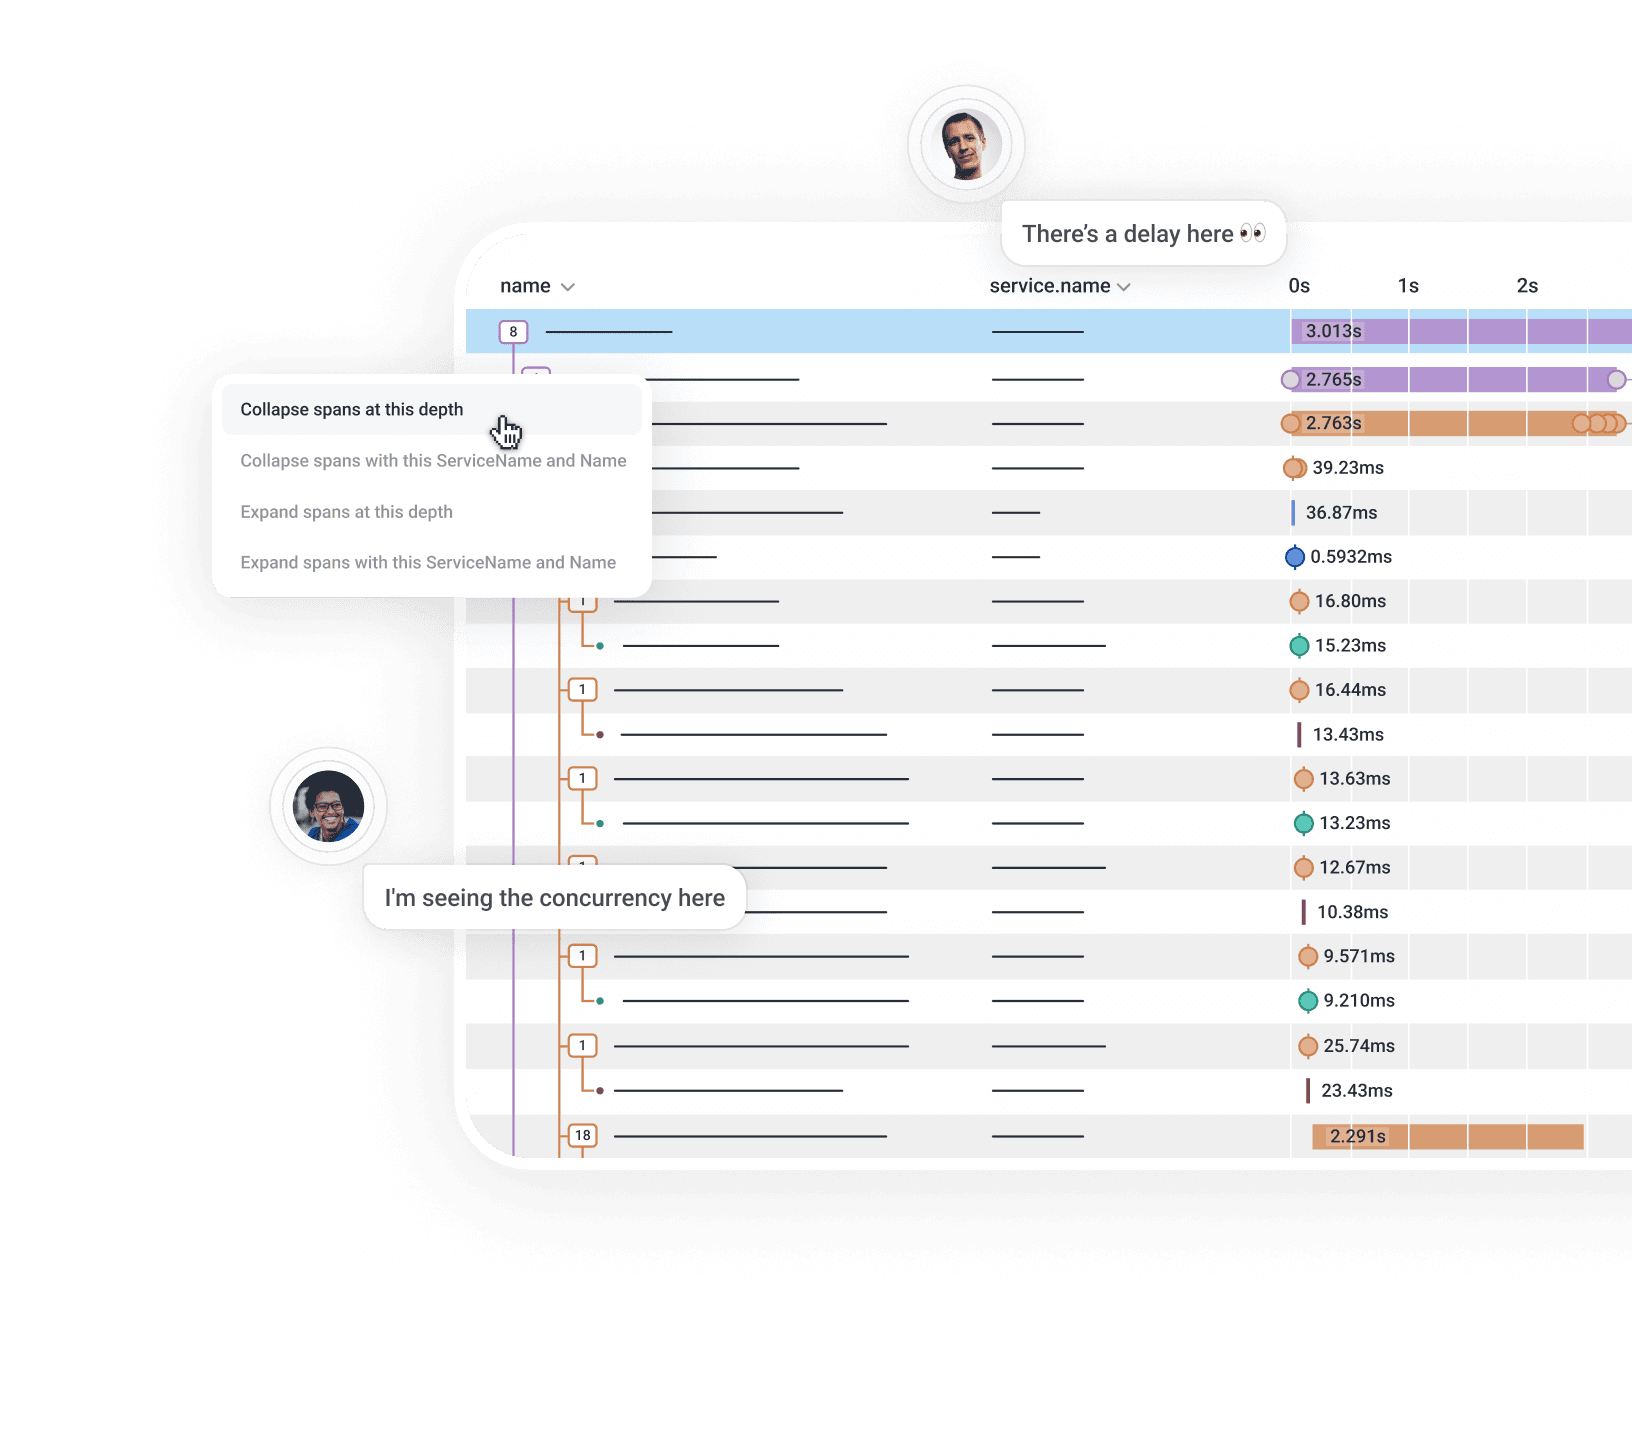
Display the full story of a request processing across all services in your stack as well as your agents, including queues, retries, LLM calls, tool invocations, and retrieval steps.
Find issues faster
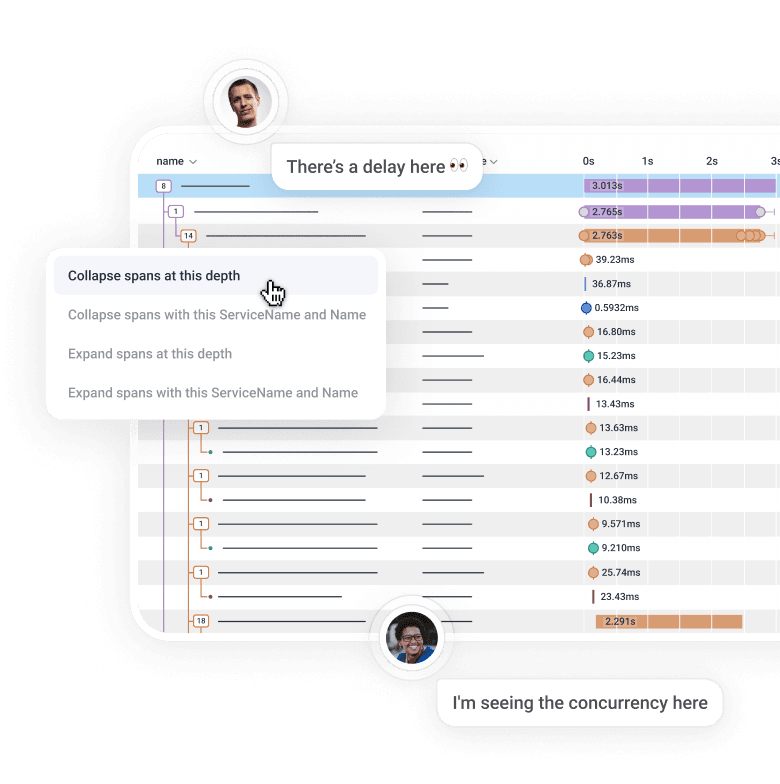
Identify the root cause of each slowdown or error. Whether it’s a slow database query or an agent stuck retrying the same tool call, a quick glance at the waterfall view will show you exactly which service is causing slow response times.
Investigate as a team, agents included
Every team member, whether human or AI agent, is looking at the same trace view. Share a Honeycomb link, and the entire team can debug from the same evidence. No more “your logs vs. my logs.”
See how it works
Watch a demo or try it for yourself in our sandbox—no registration required.
Why choose Honeycomb distributed tracing?
Find the trace you need
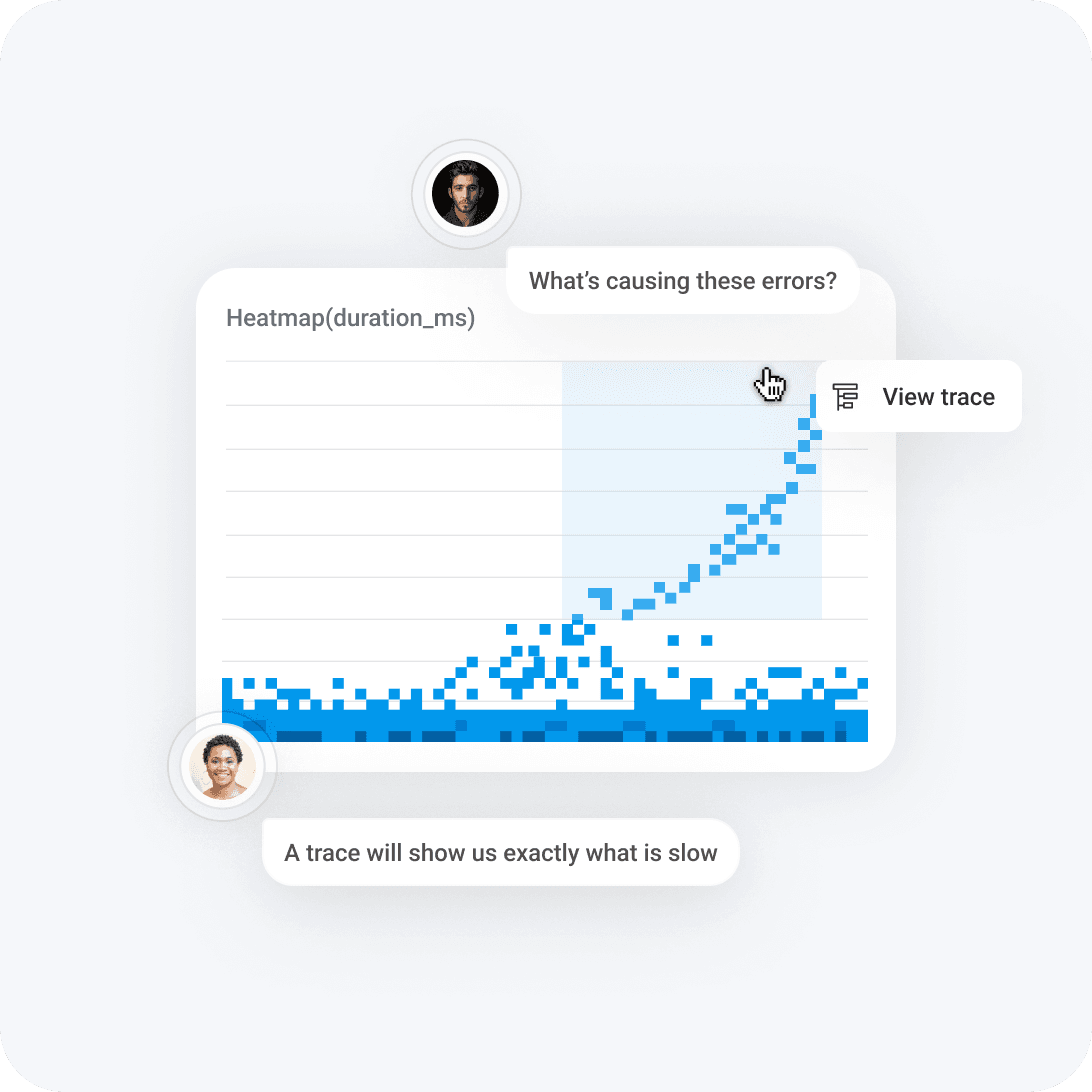
Filter by any field or click any spot in any graph to get to the associated trace, or use natural language questions in Canvas, whether you’re chasing a slow checkout or a hallucinating LLM response.
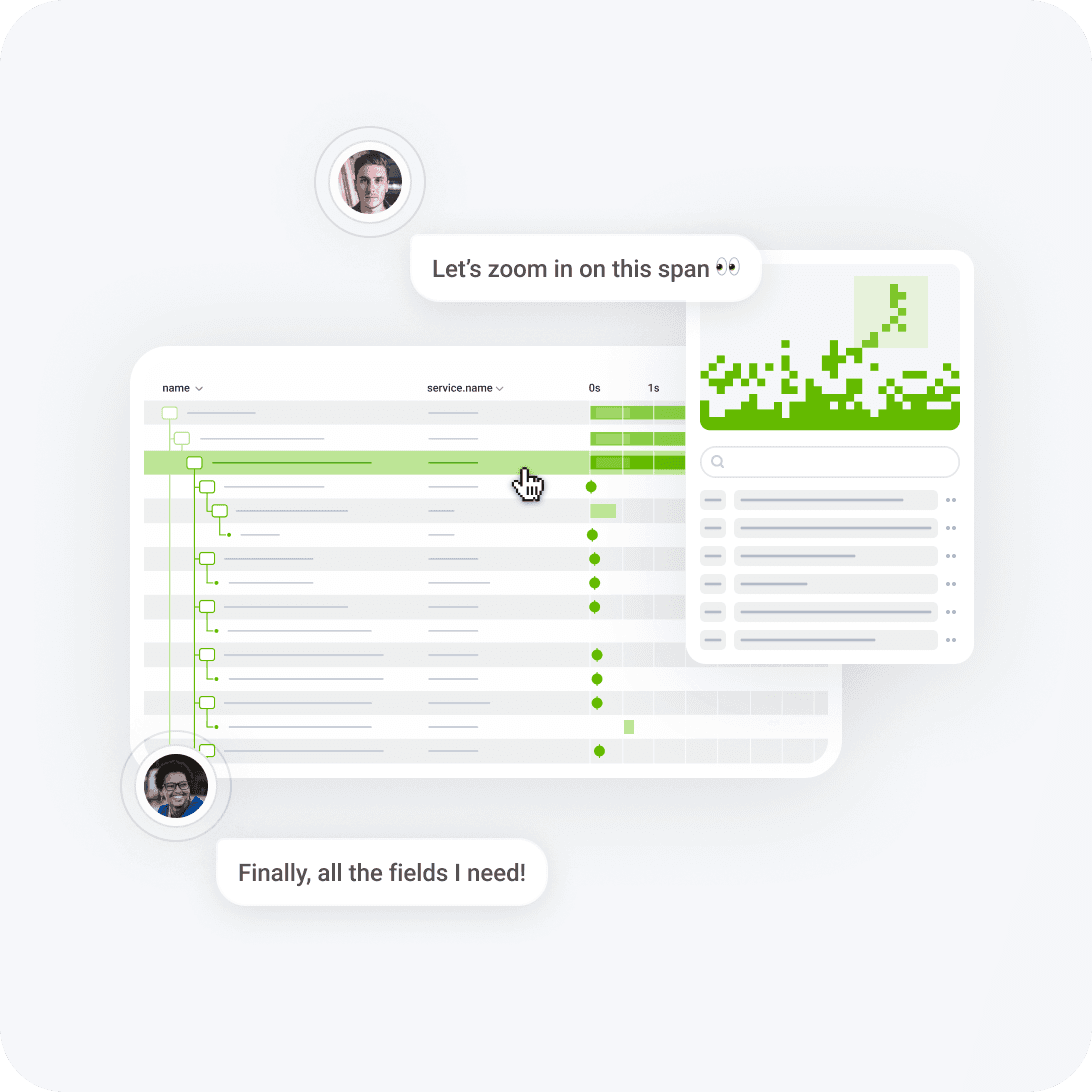
Delve into the details
Look under the hood of any trace span. See every field, every log statement, every model call and token usage. At the same time, better understand the interconnections between services. Zoom in for detail, zoom out for the big picture.
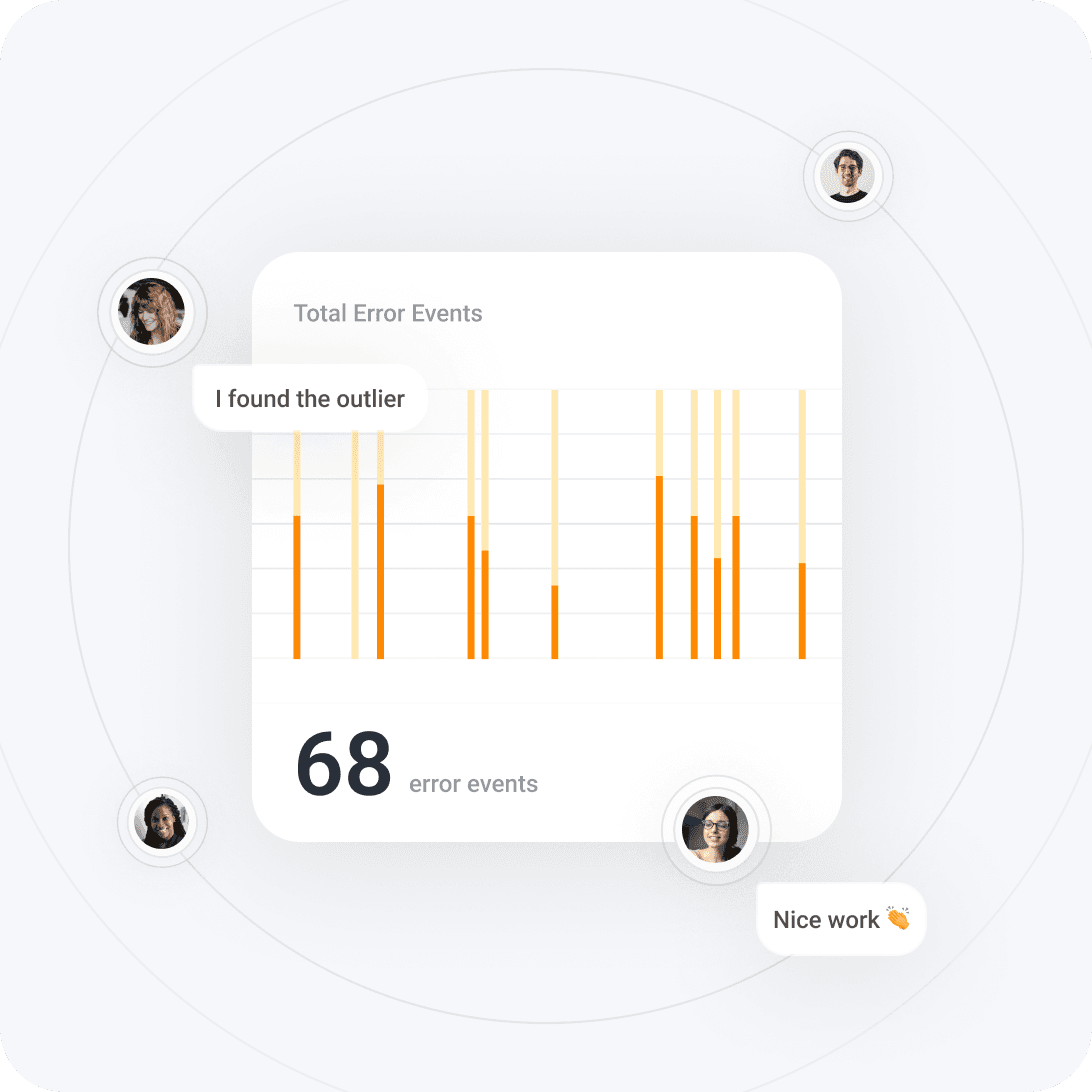
Minimize single points of failure
Let your software teach you how it works. From experienced engineers to new hires (and the agents helping both), everyone learns from what actually happens in production. Automated investigations with Canvas let even junior members of the team become observability experts.
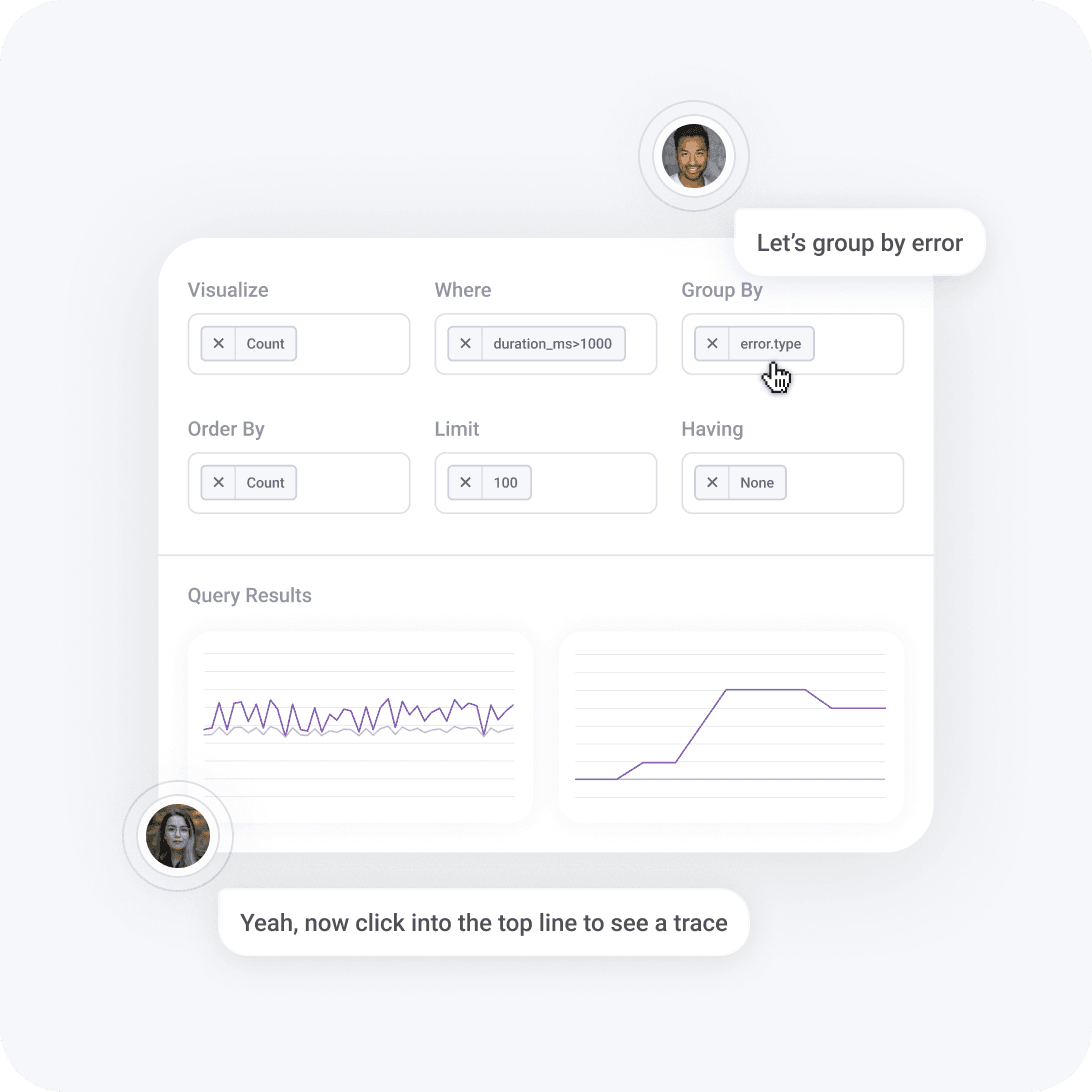
Every field is a custom metric
Query and graph over anything in your trace spans. How many calls are made to this database, and which request URL triggered them? Filter by error message and region, or by which model version served which customer, then find the customer IDs seeing the highest latency.
Hear from our community

With Honeycomb, it’s like an electron microscope. We could actually see the latency between the two data centers in milliseconds and say, okay, we shifted the right way.
We connect a customer support ticket to Honeycomb, have the agent pull the traces of what the customer saw, and can arrive at the answer before we even pick up the conversation.

Whenever a user clicks on a trace, they can see that whole workflow. With Honeycomb, we know exactly what part of the trace or where in our system is slowing that user down. If there are errors, we know exactly where they are.
Honeycomb’s distributed tracing has massive advantages over metrics and other monitoring tools. The transactions are encoded with deep information resulting in multiple visualizations that you can seamlessly switch between to get alternative perspectives on the problem and hone in on the patterns.

Kesha Mykhailov
Senior Product Engineer, Intercom
Related features
Spans with lots of useful fields + Honeycomb’s unparalleled speed = incredibly powerful experiences built on your data.
Give it a try in our sandbox
See how Honeycomb distributed tracing gives you fast, actionable answers about end user experience.