Meet the Author

Martin Thwaites
Principal Developer Advocate
Martin is a Developer Advocate at Honeycomb, o11y enthusiast, and a delivery-focused Developer from the UK. With over 20 years experience in development in the .NET ecosystem, he’s worked with many companies on scaling up engineering teams and products. The past few years have been spent working on solving complex problems with some of the UK’s big names, including e-commerce retailers and credit lenders.
Explore Author's Blog
Does OpenTelemetry in .NET Cause Performance Degradation?
Contrary to Betteridge’s Law of Tabloid Headlines, the answer to the question, “does OpenTelemetry in .NET cause performance degradation?” is yes, but context is important. I get this question so often that I thought it was time to get some stats on it.
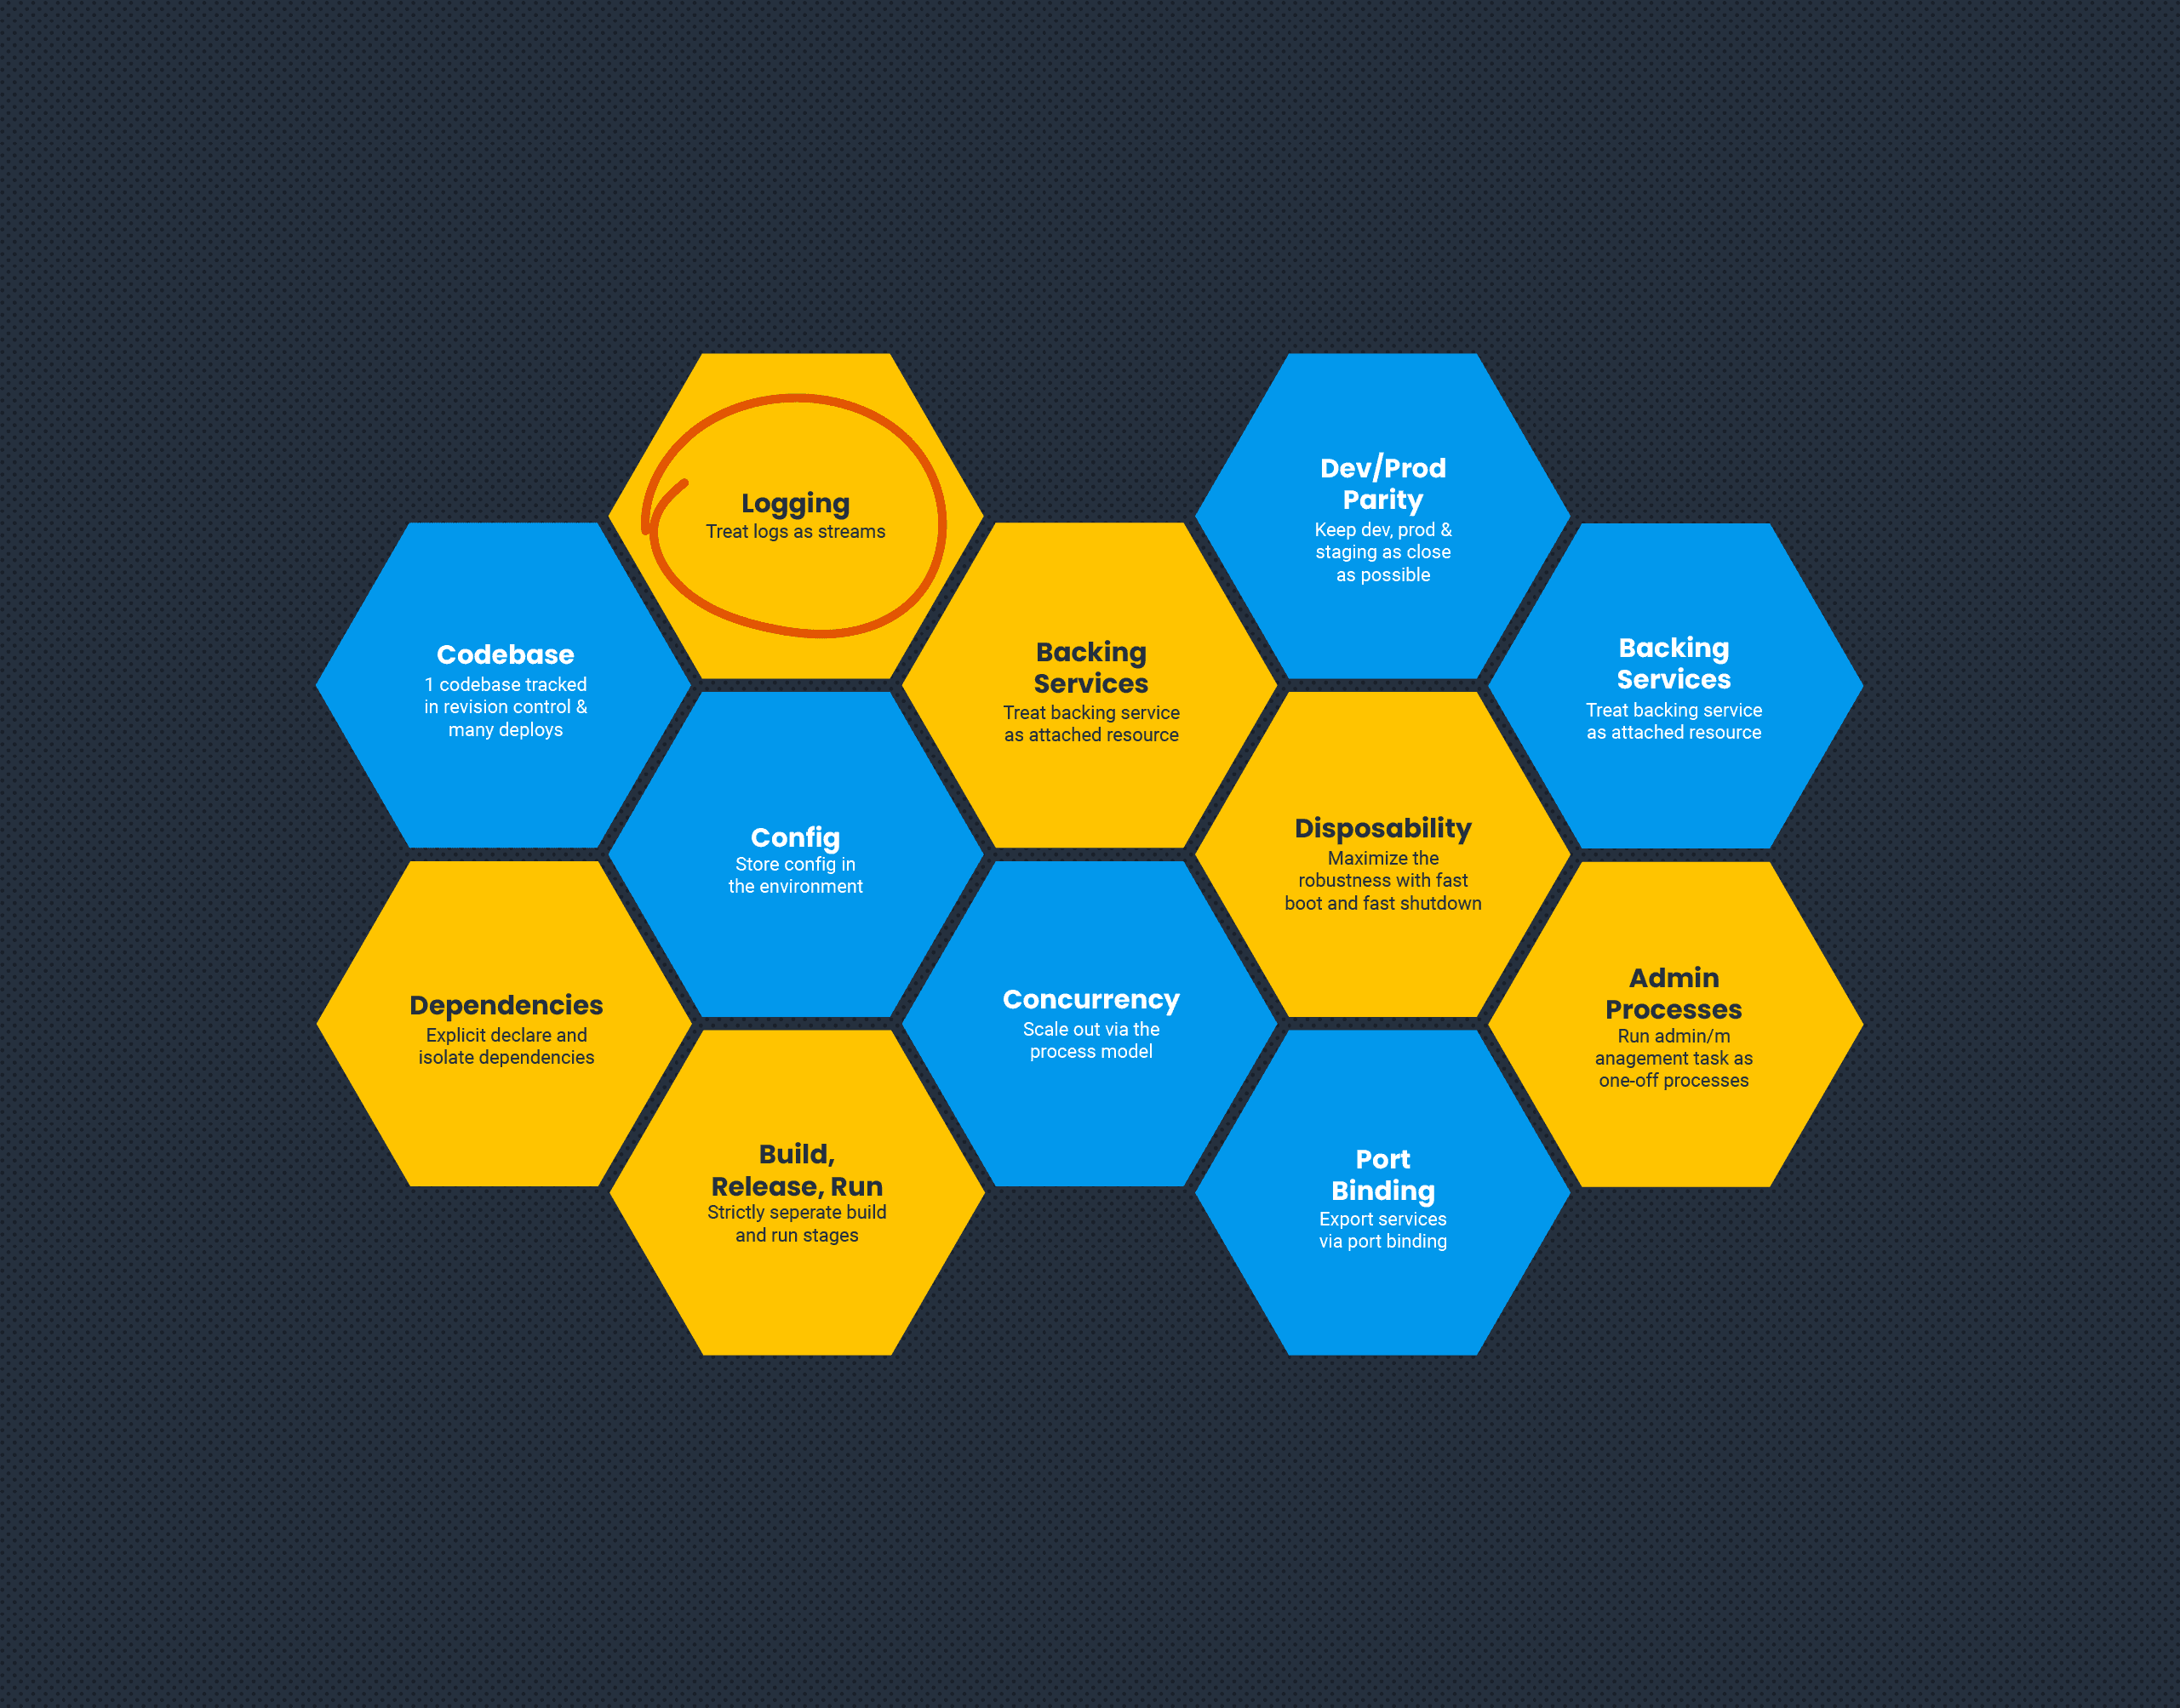
Twelve-Factor Apps and Modern Observability
The Twelve-Factor App methodology is a go-to guide for people building microservices. In its time, it presented a step change in how we think about building applications that were built to scale, and be agnostic of their hosting. As applications and hosting have evolved, some of these factors also need to. Specifically, factor 11: Logs.
Ask Miss O11y: Is There a Beginner’s Guide On How to Add Observability to Your Applications?
Dear Miss O11y, I want to make my microservices more observable. Currently, I only have logs. I’ll add metrics soon, but I’m not really sure if there is a set path you follow. Is a guide of some sort, or best practice, like you have to have x kinds of metrics? I just want to know what all possibilities are out there. I am very new to this space.
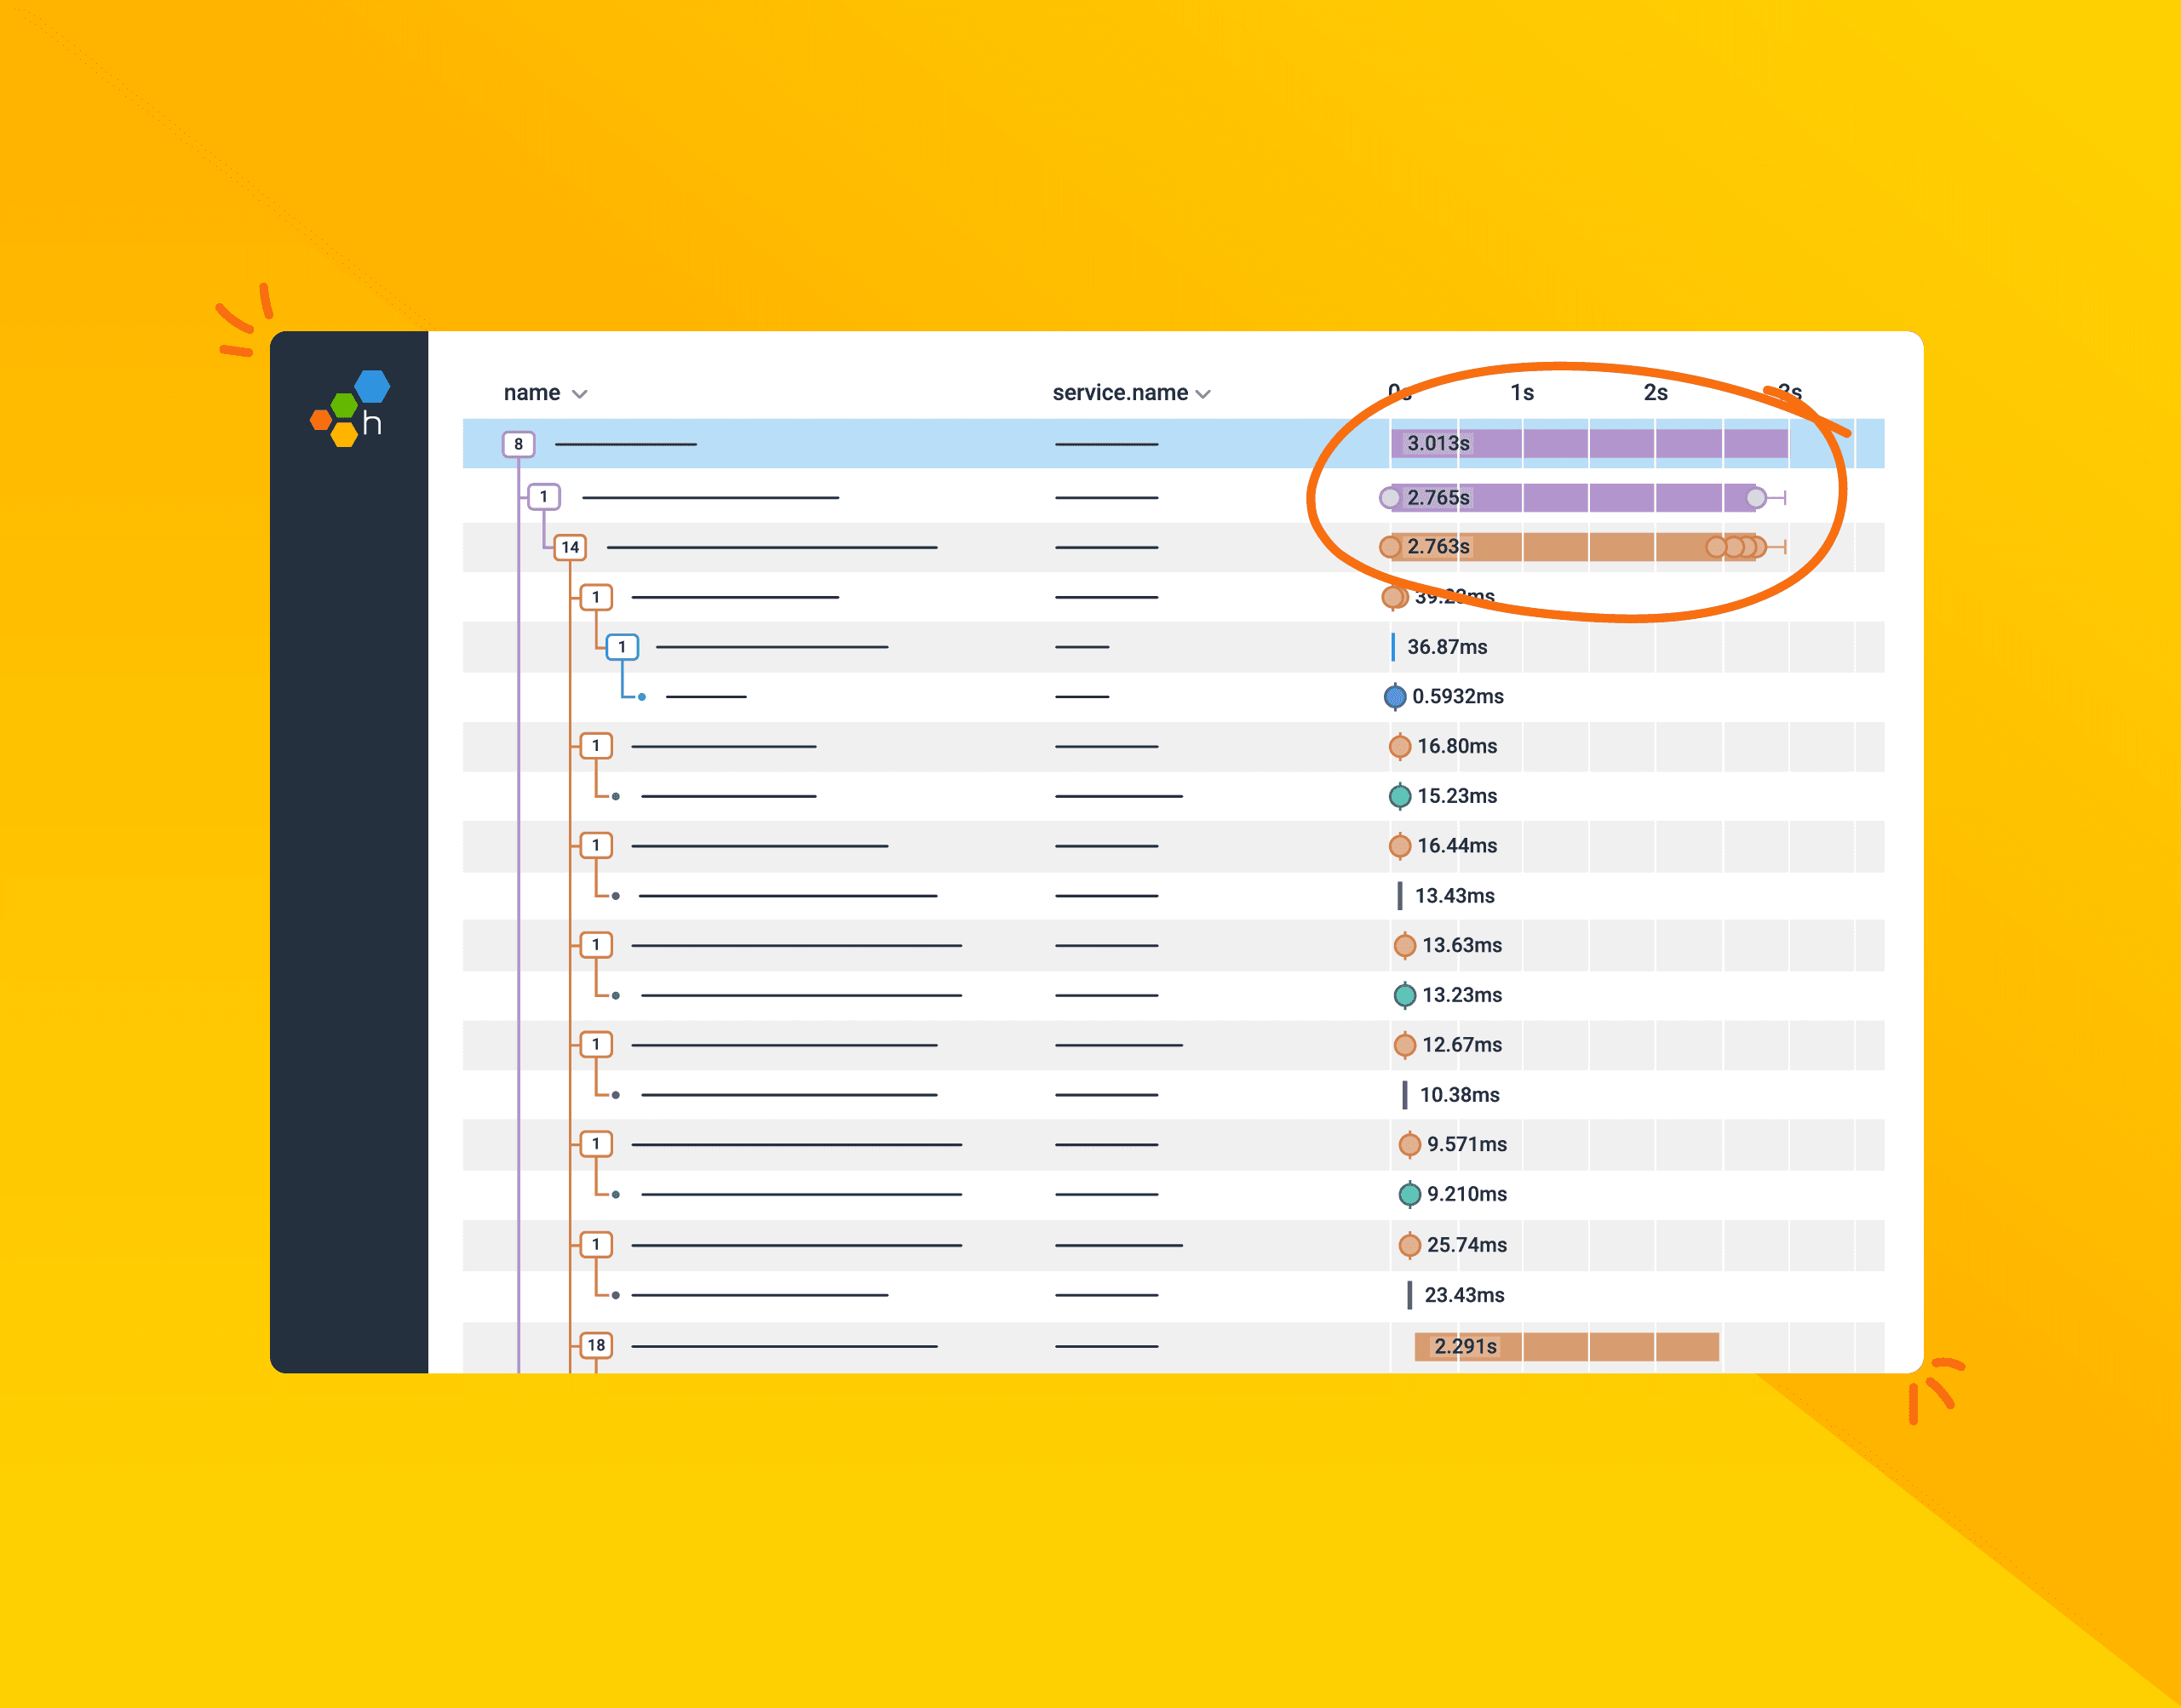
Understanding Distributed Tracing with a Message Bus
So you’re used to debugging systems using a distributed trace, but your system is about to introduce a message queue—and that will work the same… right? Unfortunately, in a lot of implementations, this isn’t the case. In this post, we’ll talk about trace propagation (manual and OpenTelemetry), W3C tracing, and also where a trace might start and finish.
Monitoring Cloud Database Costs with OpenTelemetry and Honeycomb
In the last few years, the usage of databases that charge by request, query, or insert—rather than by provisioned compute infrastructure (e.g., CPU, RAM, etc.)—has grown significantly. They’re popular for a lot of the same reasons that serverless compute functions are, as the cost will scale with your usage. No one is using your site? No problem: you’re not charged.
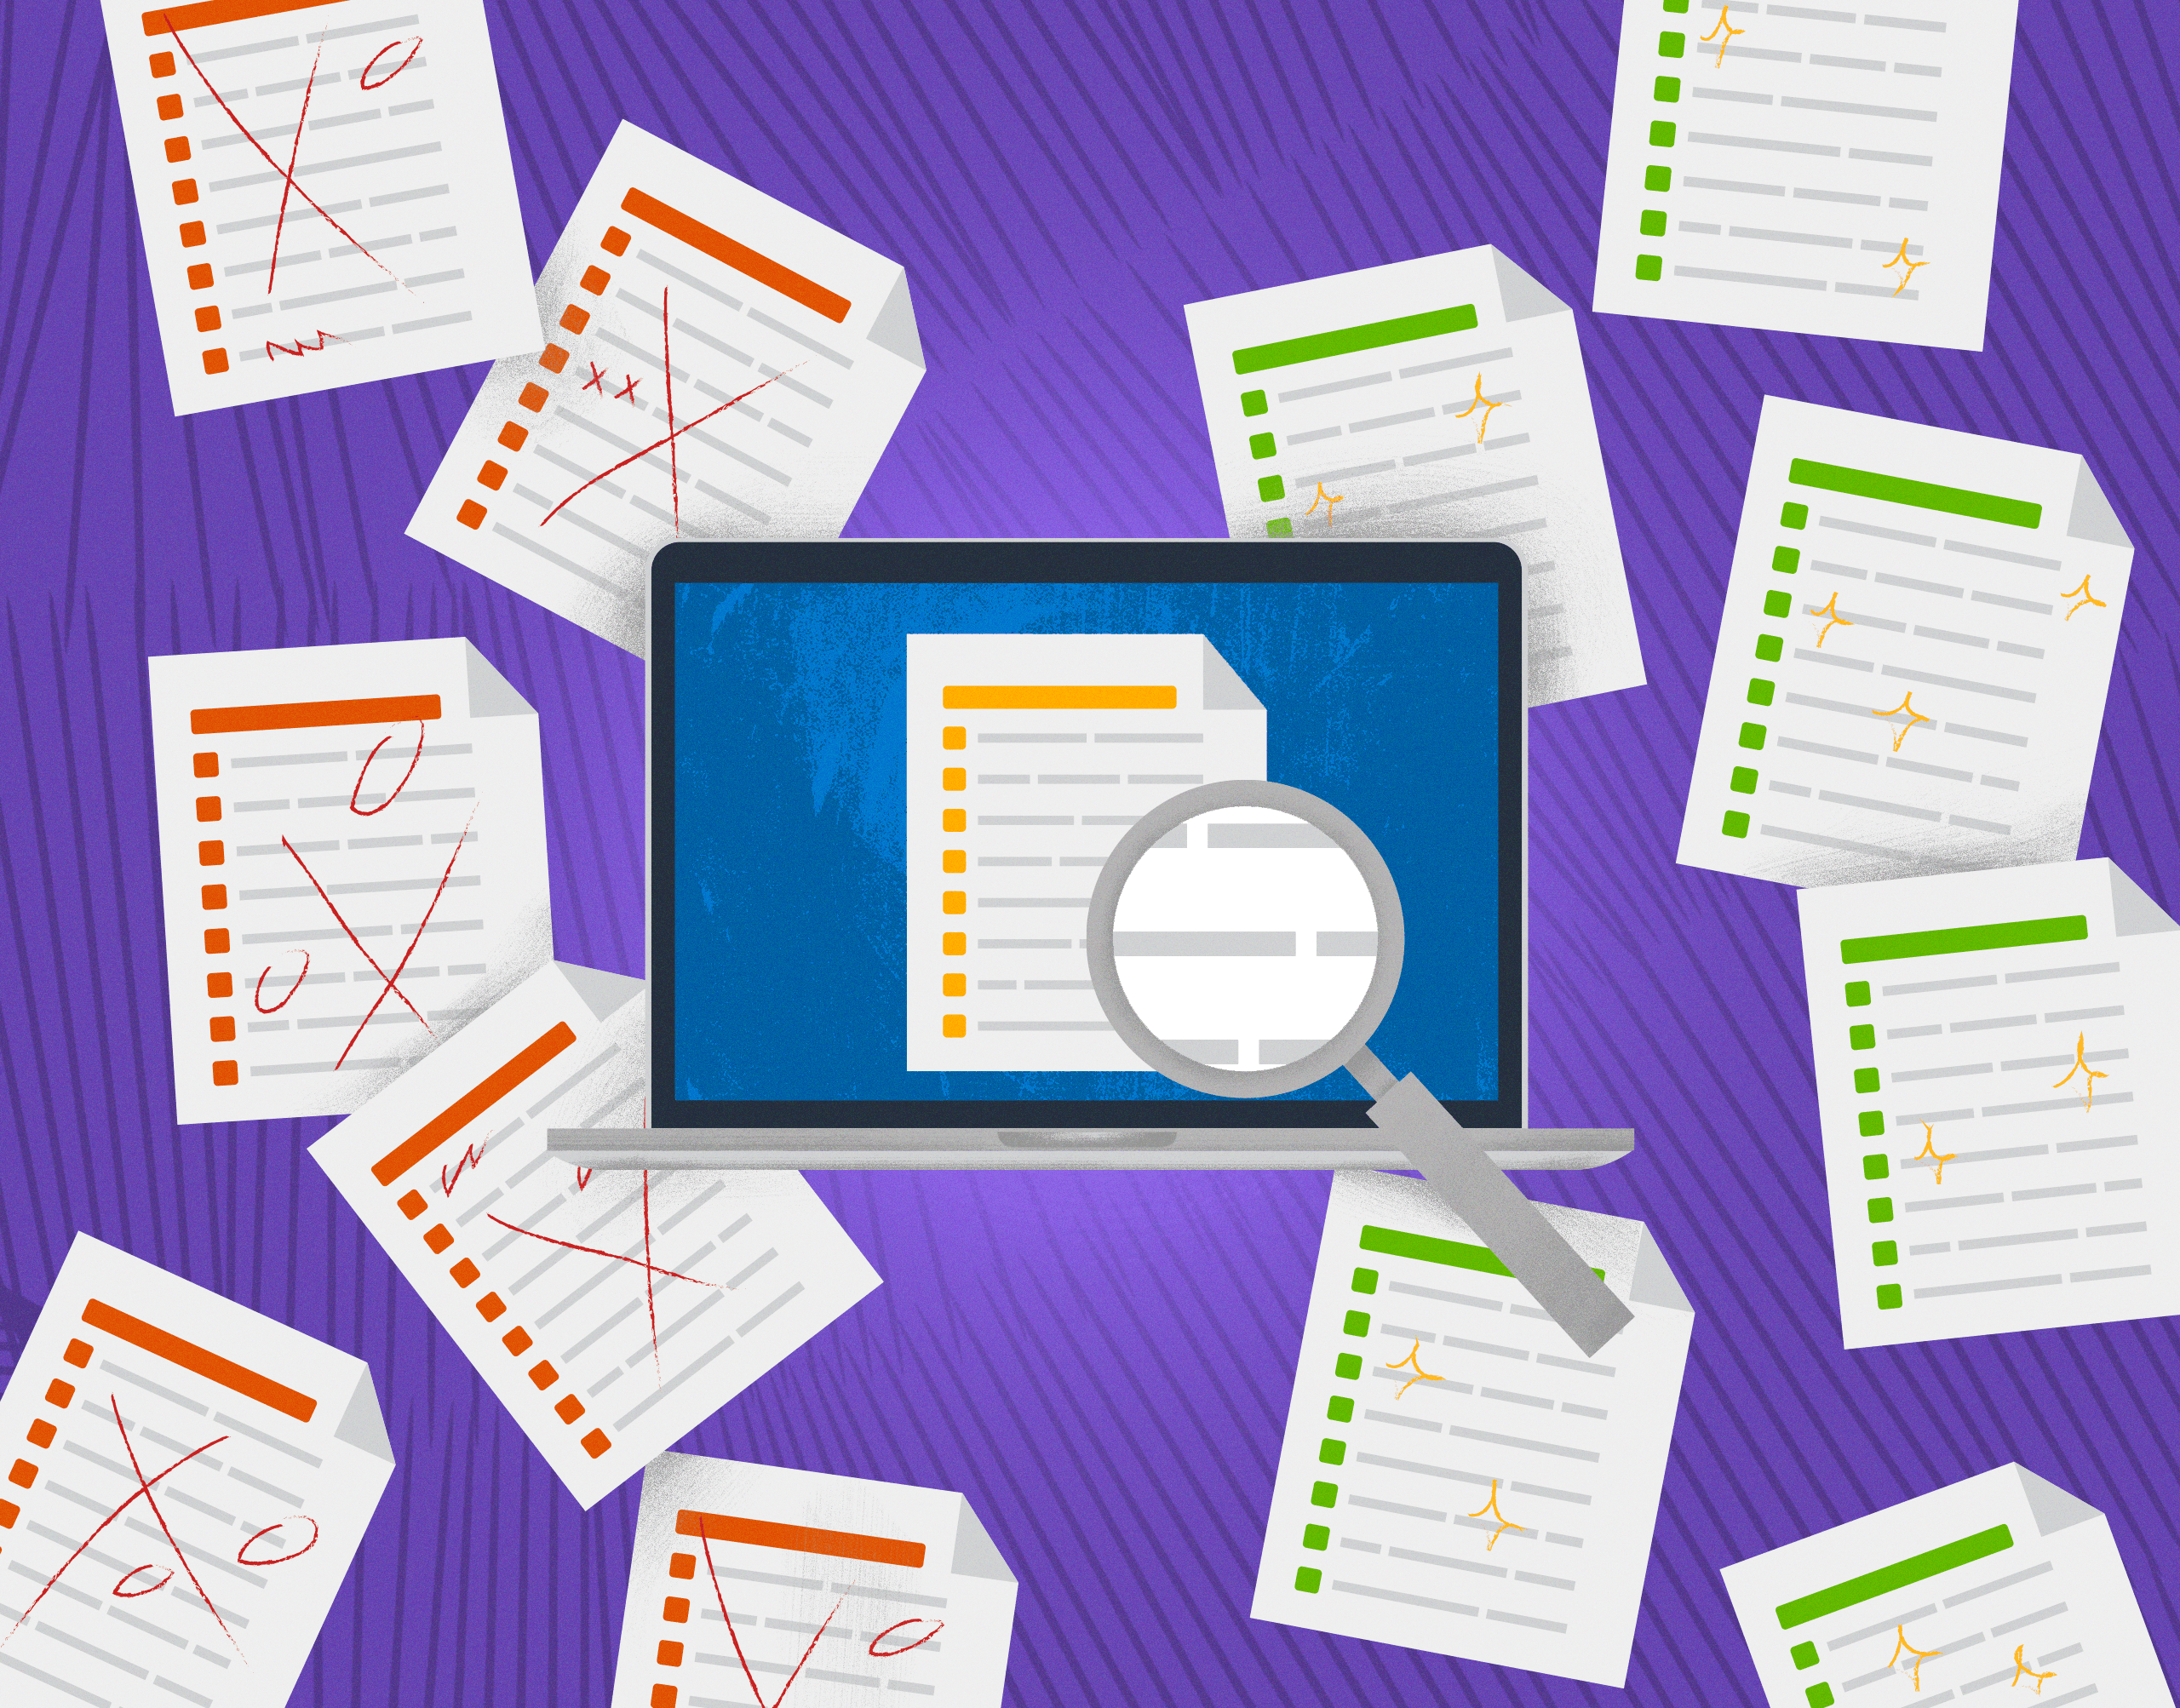
Monitoring Unit Tests with OpenTelemetry in .NET
In this post, we’ll look at how you can use OpenTelemetry to monitor your unit tests and send that data to Honeycomb to visualize. It’s important to note that you don’t need to adopt Honeycomb, or even OpenTelemetry, in your production application to get the benefit of tracing. This example uses OpenTelemetry purely in the test project and provides great insights into our customer’s code.
Authors’ Cut—Not-So-Distant Early Warning: Making the Move to Observability-Driven Development
Observability is about understanding systems, which means more than just production. Moving from logs to tracing and showing causality can be done locally, as well. We can give developers the same superpowers that SREs have: observability-driven development.
Adding Code Tags to Your OpenTelemetry Spans
One of the reasons that OpenTelemetry is great at doing this is that a lot of the common attributes you may find on a span are given standard names, so the systems receiving the data to visualize them don’t need to know the specifics of your system. This is really a superpower of OpenTelemetry, as it gives a level playing field for consumers of that information—meaning that you, as a developer, can forget about vendor-specific things.
Ask Miss O11y: My Manager Won’t Let Me Spend Any Time Instrumenting My Code
In the same way as the business is likely ok with you writing developer-based tests (unit, automation, integration), instrumentation is the same. The conversation we need to have is that instrumentation, or knowing the system is healthy, is the work we need to do for the feature. In my opinion, it’s even more important than those.
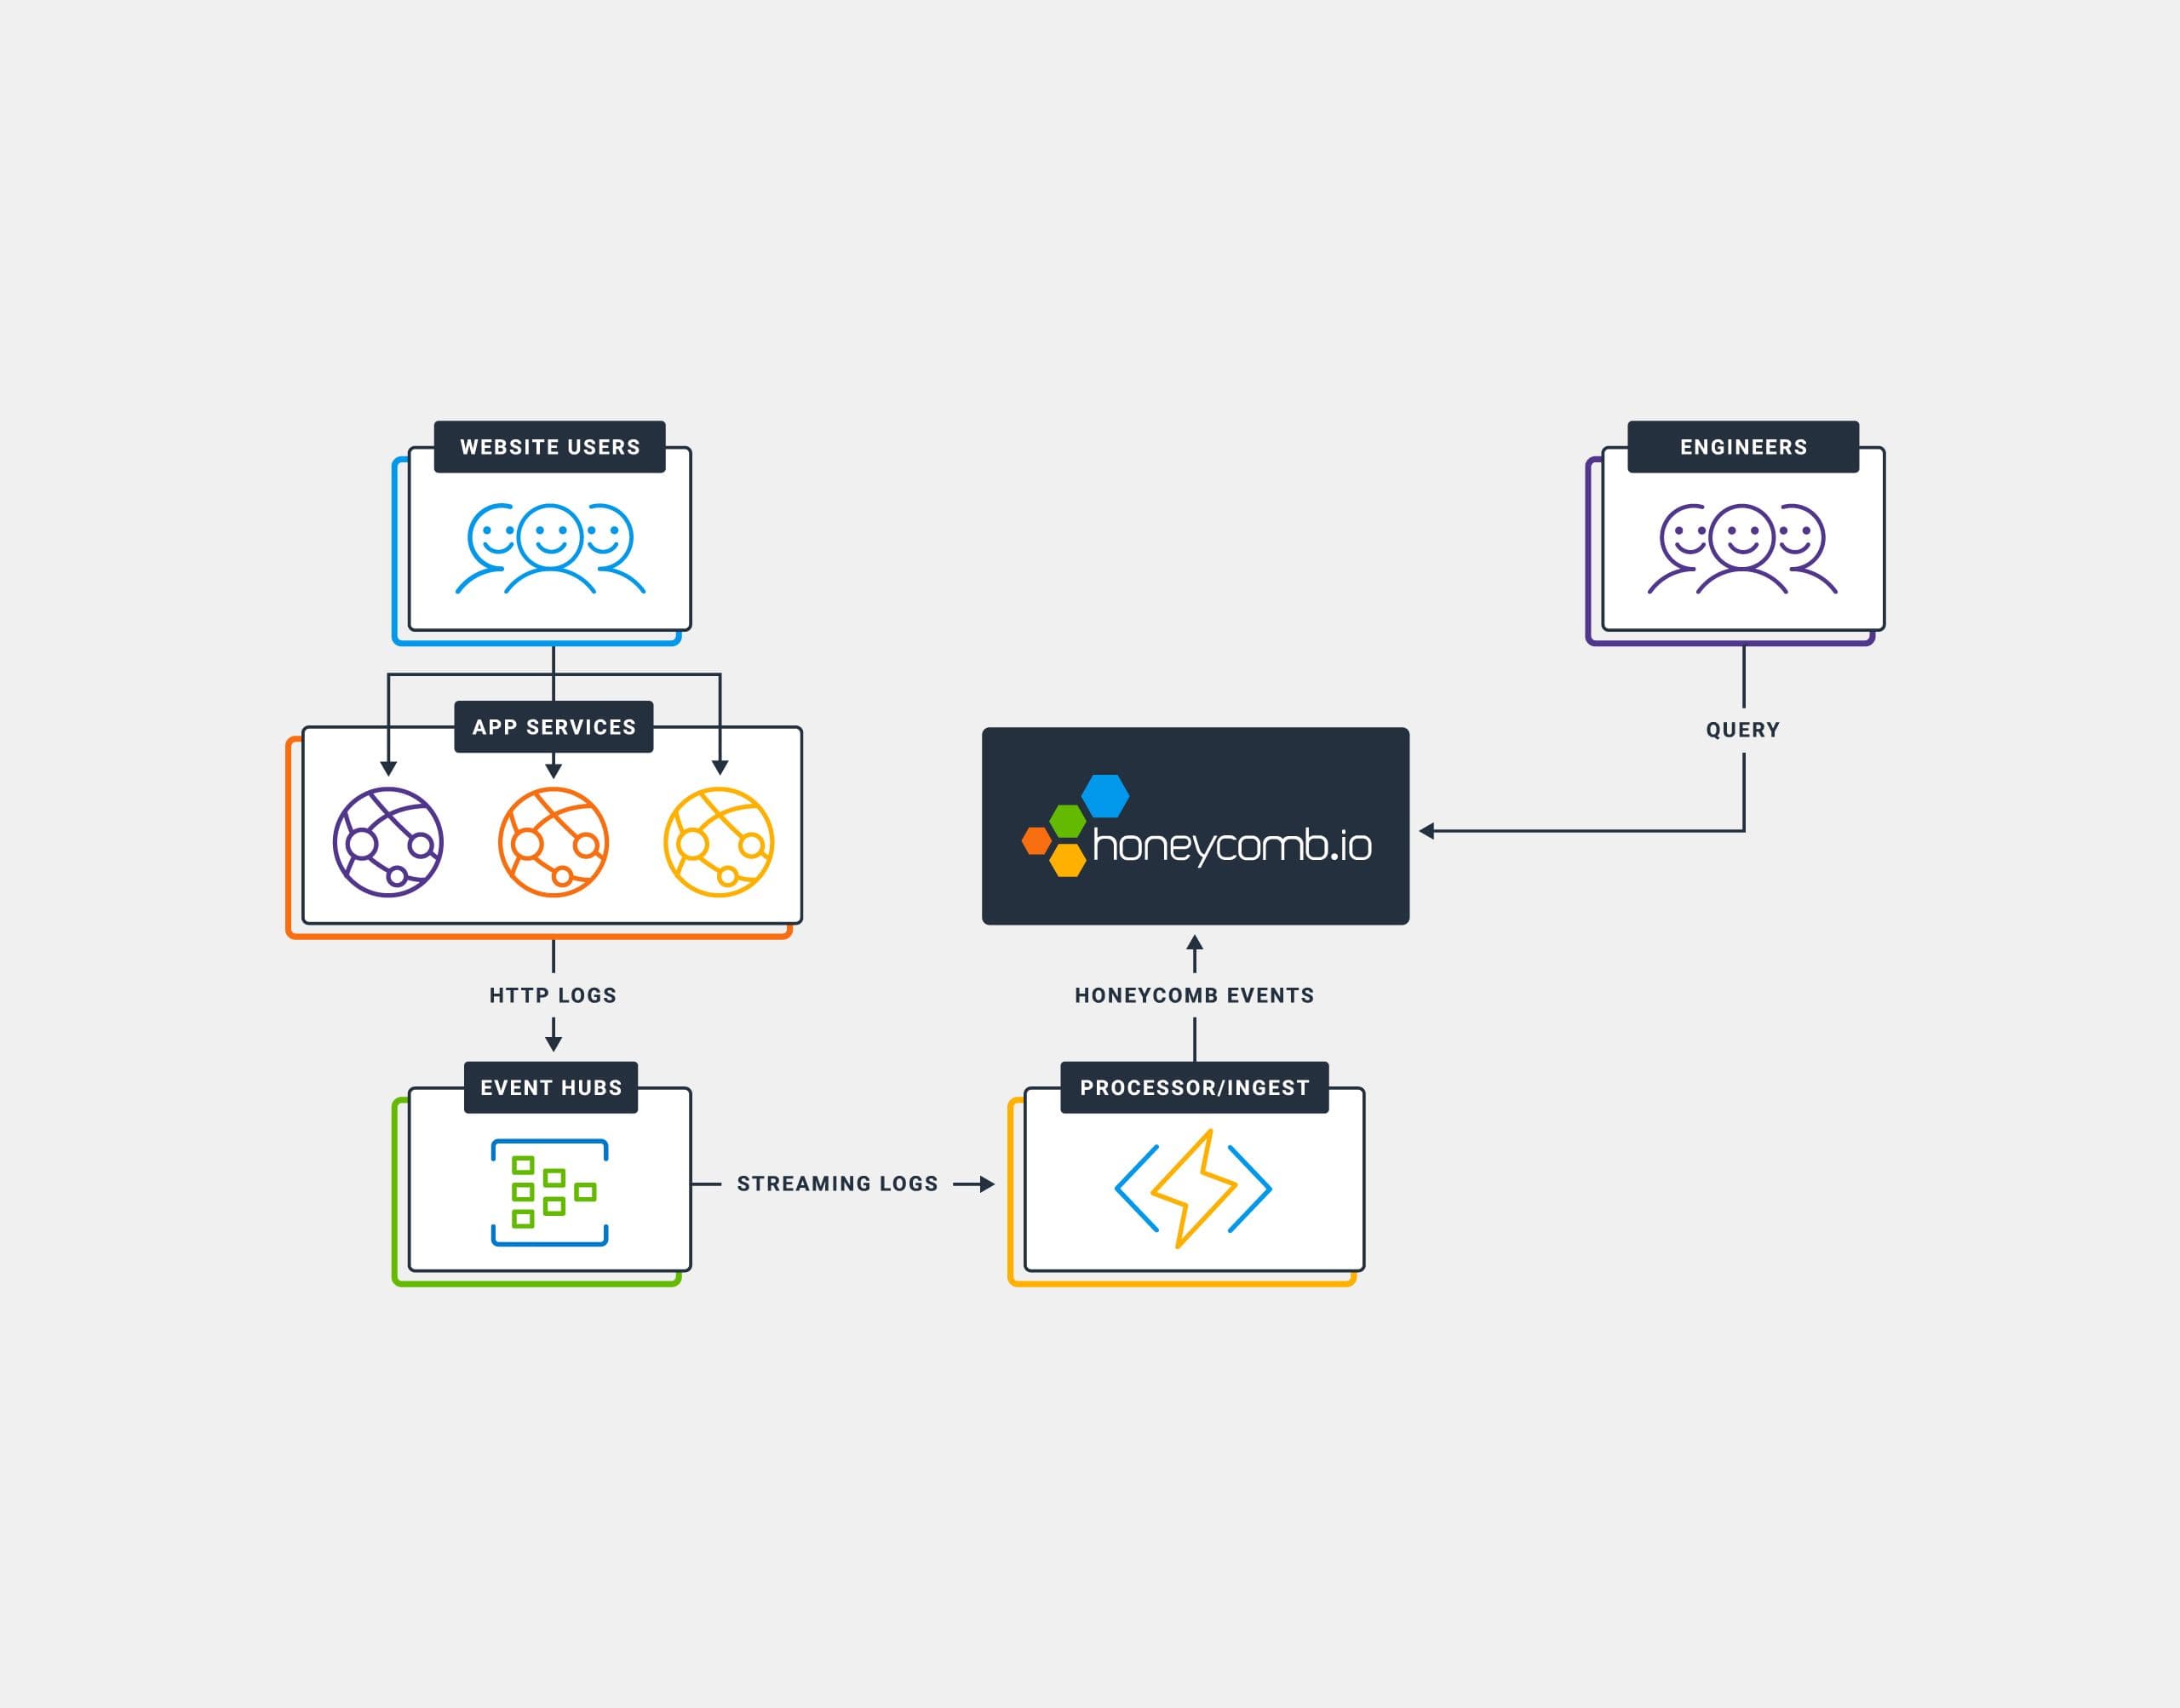
Ingesting HTTP Access Logs from AppService
Debugging application performance in Azure AppService is something that’s quite difficult using Azure’s built-in services (like Application Insights). Among some of the issues are visualizations, and the time it takes to be able to query data. In this post, we’ll walk through the steps to ingest HTTP Access Logs from Azure AppService into Honeycomb to provide for near real-time analysis Access Logs.