Using Core Web Vitals in Honeycomb Frontend Telemetry
In this blog post, I'll discuss some behaviors encountered using Core Web Vitals telemetry, enabled via the Honeycomb Frontend Web SDK. This telemetry is generated from events from Google's Web Vitals script.

By: Ken Rimple
Migrate from RUM to Honeycomb for Frontend Observability
Download
Google's Core Web Vitals (CWVs) measurements have been used by web administrators and SREs to review frontend application performance metrics, and have been factored into Google's page rankings since 2021. They are also used in Google Analytics, which crawls websites and evaluates performance metrics over a period of multiple days, and with various frontends (desktop web, mobile web, etc.) to establish how well a website performs in production.
In this blog post, I'll discuss some behaviors encountered using Core Web Vitals telemetry, enabled via the Honeycomb Frontend Web SDK. This telemetry is generated from events from Google's Web Vitals script.
The key CWVs, as of January 2026, are:
- Time to First Byte (TTFB) - how long it takes between requesting a page and getting the initial measurable byte of data from the server. Reported once per page load.
- First Contentful Paint (FCP) - how long it takes before the browser is ready to paint DOM elements on the page. Reported once per page load.
- Cumulative Layout Shift (CLS) - the worst (so far) shift in page layout, usually caused by incoming data or by Javascript events. This measurement is a decimal number, with values greater than 0.25 representing a poor user experience. CLS can be reported multiple times during interactions with a page. Reported zero or more times, Reported each time it increases.
- Largest Contentful Paint (LCP) - the render time of the largest element, such as an image, text block, or video, relative to the first navigation to the page. This CWV is not always reported—see details below on why!
- Interaction to Next Paint (INP) - a number representing the latency involved in user interactions with a given page. Reported zero or more times when the latency blocks the next paint.
Note that some of these web vitals are reported once during page load (TTFB, FCP). Others may be reported later and possibly more than once (LCP, CLS, INP) as the user interacts with the page.
RUM can leave questions unanswered. Honeycomb for Frontend Observability doesn’t.
Viewing Core Web Vitals in Chrome
Chrome Developer Tools lets you see your own browser's CWVs. Simply go to the Performance tab and you'll see a visualization of the key three (LCP, CLS and INP):
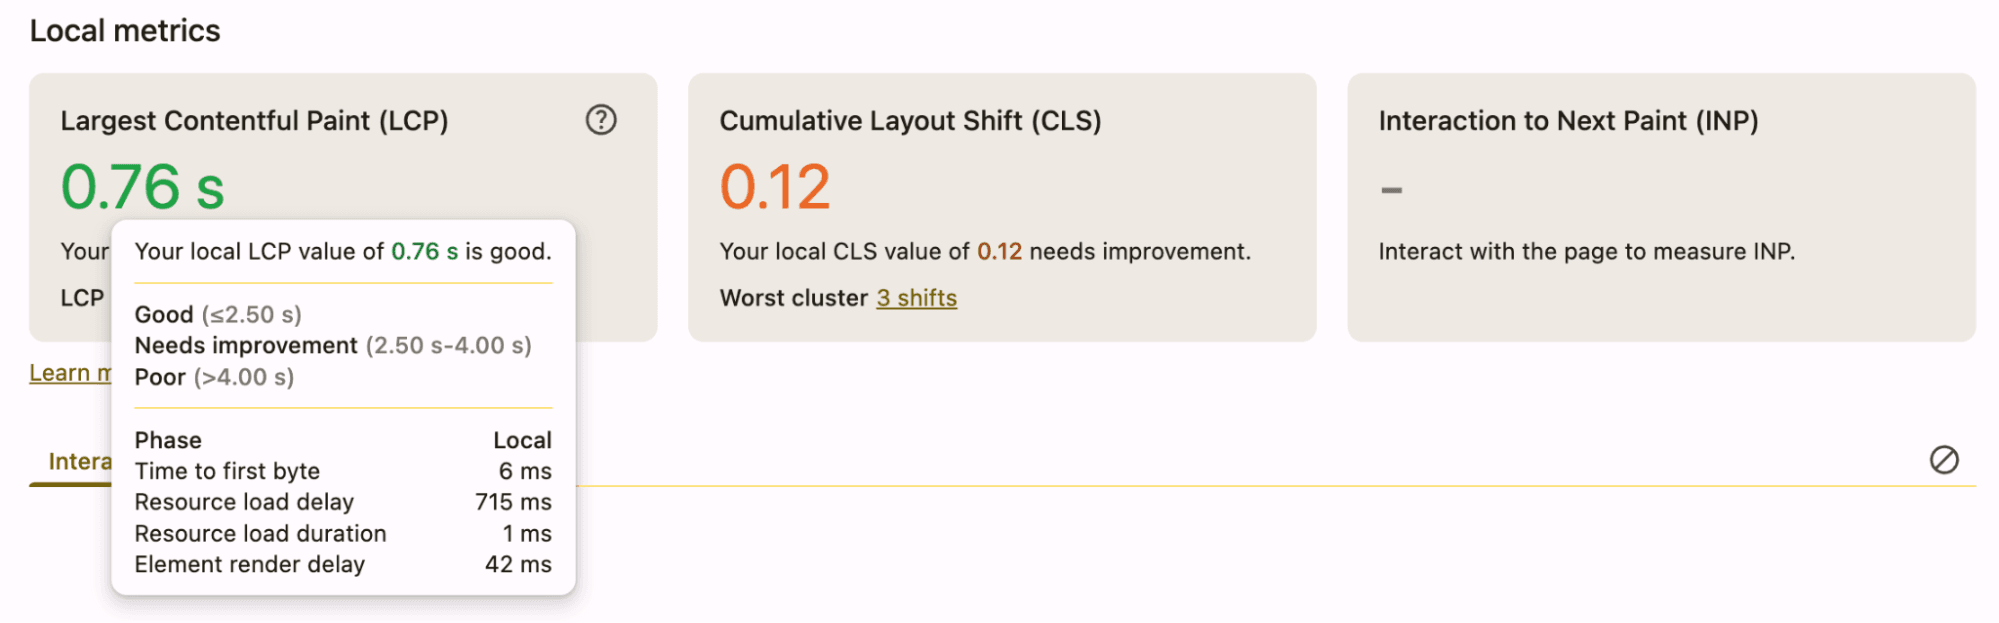
This is great for localized debugging, but it doesn't represent user experience in a production environment.
Core Web Vitals in Honeycomb Frontend Observability
Honeycomb, not coincidentally, also shows visualizations for the same three Core Web Vitals in the Honeycomb Frontend Observability launchpad:
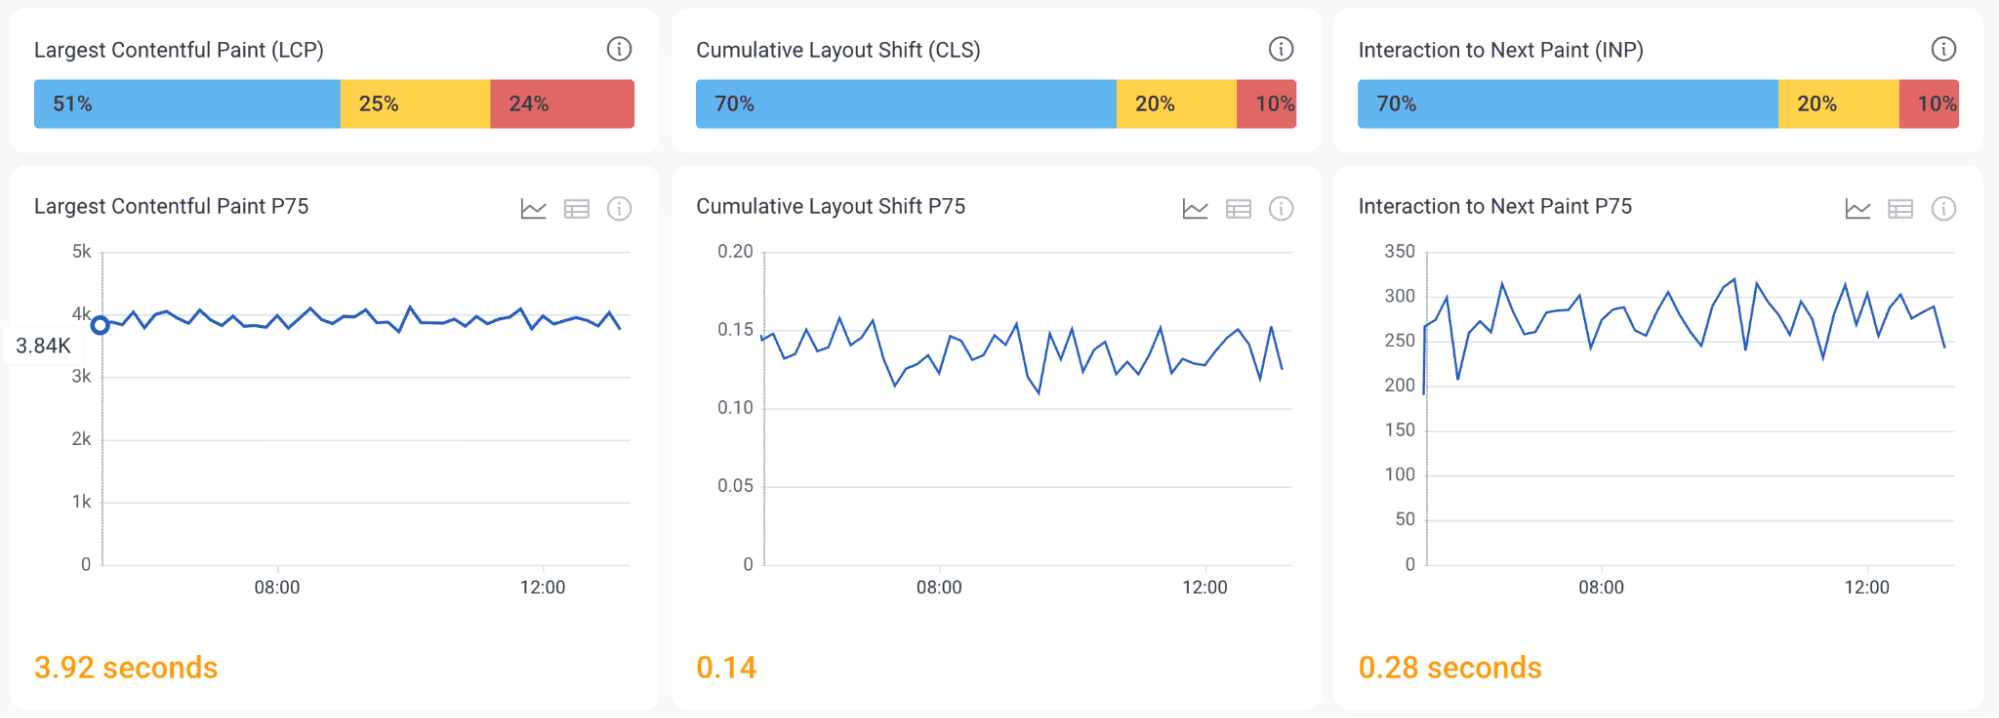
The other two web vitals, TTFB and FCP, are also tracked and can be queried the same way.
Single page applications and Core Web Vitals
Core Web Vitals are easier to reason about when working with server-generated page content. The pages load, become interactive, and allow user input, which causes the output of all of the above measurements.
A single page application loads an application into the browser, and the application takes the place of actual page-to-page navigation by keeping its DOM in memory and replacing views when "routing" from navigation to navigation. This has ramifications for some of the vitals.
For example, when browsing to Gmail, the main page shell is loaded and should generate the following events:
- Time to First Byte (TTFB)
- First Contentful Paint (FCP)
- Largest Contentful Paint (LCP)
- Possibly Cumulative Layout Shift (CLS)
Each successive action taken (such clicking on an email in Google Mail) executes some JavaScript code, and then may cause a portion of the page to be updated dynamically. This could result in:
- Cumulative Layout Shift (CLS) events as the page content updates
- Interaction to Next Paint (INP) event if the script takes a significant amount of time to execute and becomes a new, slower user latency time
You'll note that we don't see another Largest Contentful Paint (LCP) here. An in-page routing action is not an actual page load, so the Largest Contentful Paint score will not be re-evaluated, since it is only measured at original page load time.
Honeycomb's Core Web Vitals instrumentation
Honeycomb has implemented CWV reporting in the Honeycomb Web SDK using Google's Web Vitals library. The instrumentation sends events as single-span traces. Each event includes:
- The individual CWV name as the
nameattribute (TTFB,FCP,LCP,CLS,INP) - The value of the CWV as well as its ranking (
good,needs improvement, orpoor) - Browser and device attributes
- Page navigation information, such as the current page route and URL
- The calculated duration of the given CWV event in
duration_ms. However, any duration is also captured in the appropriate CWV’s value, attribute (lcp.value,fcp.value,inp.value) - The element involved or targeted for the CWV, where available (
lcp.element,inp.element,cls.element) - The current Frontend Observability SDK's
session.id, representing user interactions over time. The generation and management of thesession.idcan be customized
Users can ask, "What's different?" about the good or poor scores by using BubbleUp. This feature compares all of the attributes captured for each CWV event, such as the ones detailed above. Users can also query all trace data by session.id to gain an understanding of each user's path through the application.
Core Web Vitals output conditions
Each of the Core Web Vitals scores are emitted differently by Google’s library. Generally, all page loads should generate TTFB and FCP trace spans immediately. Below are some of the conditions that factor into a generated event for LCP, CLS, and INP vitals.
Largest Contentful Paint
A Largest Contentful Paint span is generated, at most, one time after the initial page load. The browsers use the PerformanceObserver feature to watch for operations during the initial load of a page, and the CWVs library reports on the one with the longest duration.
LCP is one of the more complex web vitals to measure. Because pages generally request multiple streams of data, any one of those operations may become the largest contentful paint. The observation stops when a user interacts in some way with the page by making it visible, clicking, typing, or scrolling.
In some cases, the LCP may not be measured:
- Pages loaded in background tabs
- Pages that begin loading, and then are switched to the background before a contentful paint occurs (but the LCP score may be emitted, if captured, once the page becomes visible again)
- The user navigates away from the page before the LCP is calculated
- The browser doesn't support the
largest-contentful-paintperformance entry type (for example, Safari mobile, before the iOS 26.2 beta, did not record or report LCPs)
Therefore, the number of LCP events emitted over many page loads will be the same or less than the number of FCP events emitted. Sometimes neither LCP or even FCP are generated for a page that opened in the background and never became interactive.
SPA routes and "soft LCPs"
Single page applications only record LCPs on their initial landing page. Navigating to another client-side route stops any further LCP evaluation, if the LCP wasn't stopped earlier in the landing page interactions. And so the LCP, if sent, is reported against the landing page.
Google is researching the concept of a "soft LCP" measurement and has provided an experimental branch of their CWVs library. However, it has not been adopted into the main branch and it is not compatible with the Honeycomb Core Web Vitals instrumentation.
Cumulative Layout Shifts
CLS events may also be suppressed when the page/tab is backgrounded before the CLS can be generated. Long-running pages (days or hours) may be backgrounded by users. In this case, the CLS score may be sent hours or days after page load. Details on these conditions are documented on the CLS definition page.
Interaction to Next Paint
Not all pages report INP events, especially if no user interaction occurs. Scrolling and hovering won't generate INPs.
Honeycomb and the Google Web Vitals library version
The Honeycomb Web SDK uses semantic versioning and dependabot to keep the Core Web Vitals library up to date for each release. The resolved version for release 1.2.0 of the Web SDK is version 5.1.0.
Alternatives to Web Vitals for client-side routing
Though a useful set of measurements, Core Web Vitals are not always the most important performance metrics in a single page application. SPA route changes can be treated as their own telemetry event, for example. React router navigations, fetch, and XMLHttpRequest calls may generate trace spans via automatic instrumentation, for example. And the user interaction instrumentation can generate trace spans for browser events such as click and submit.
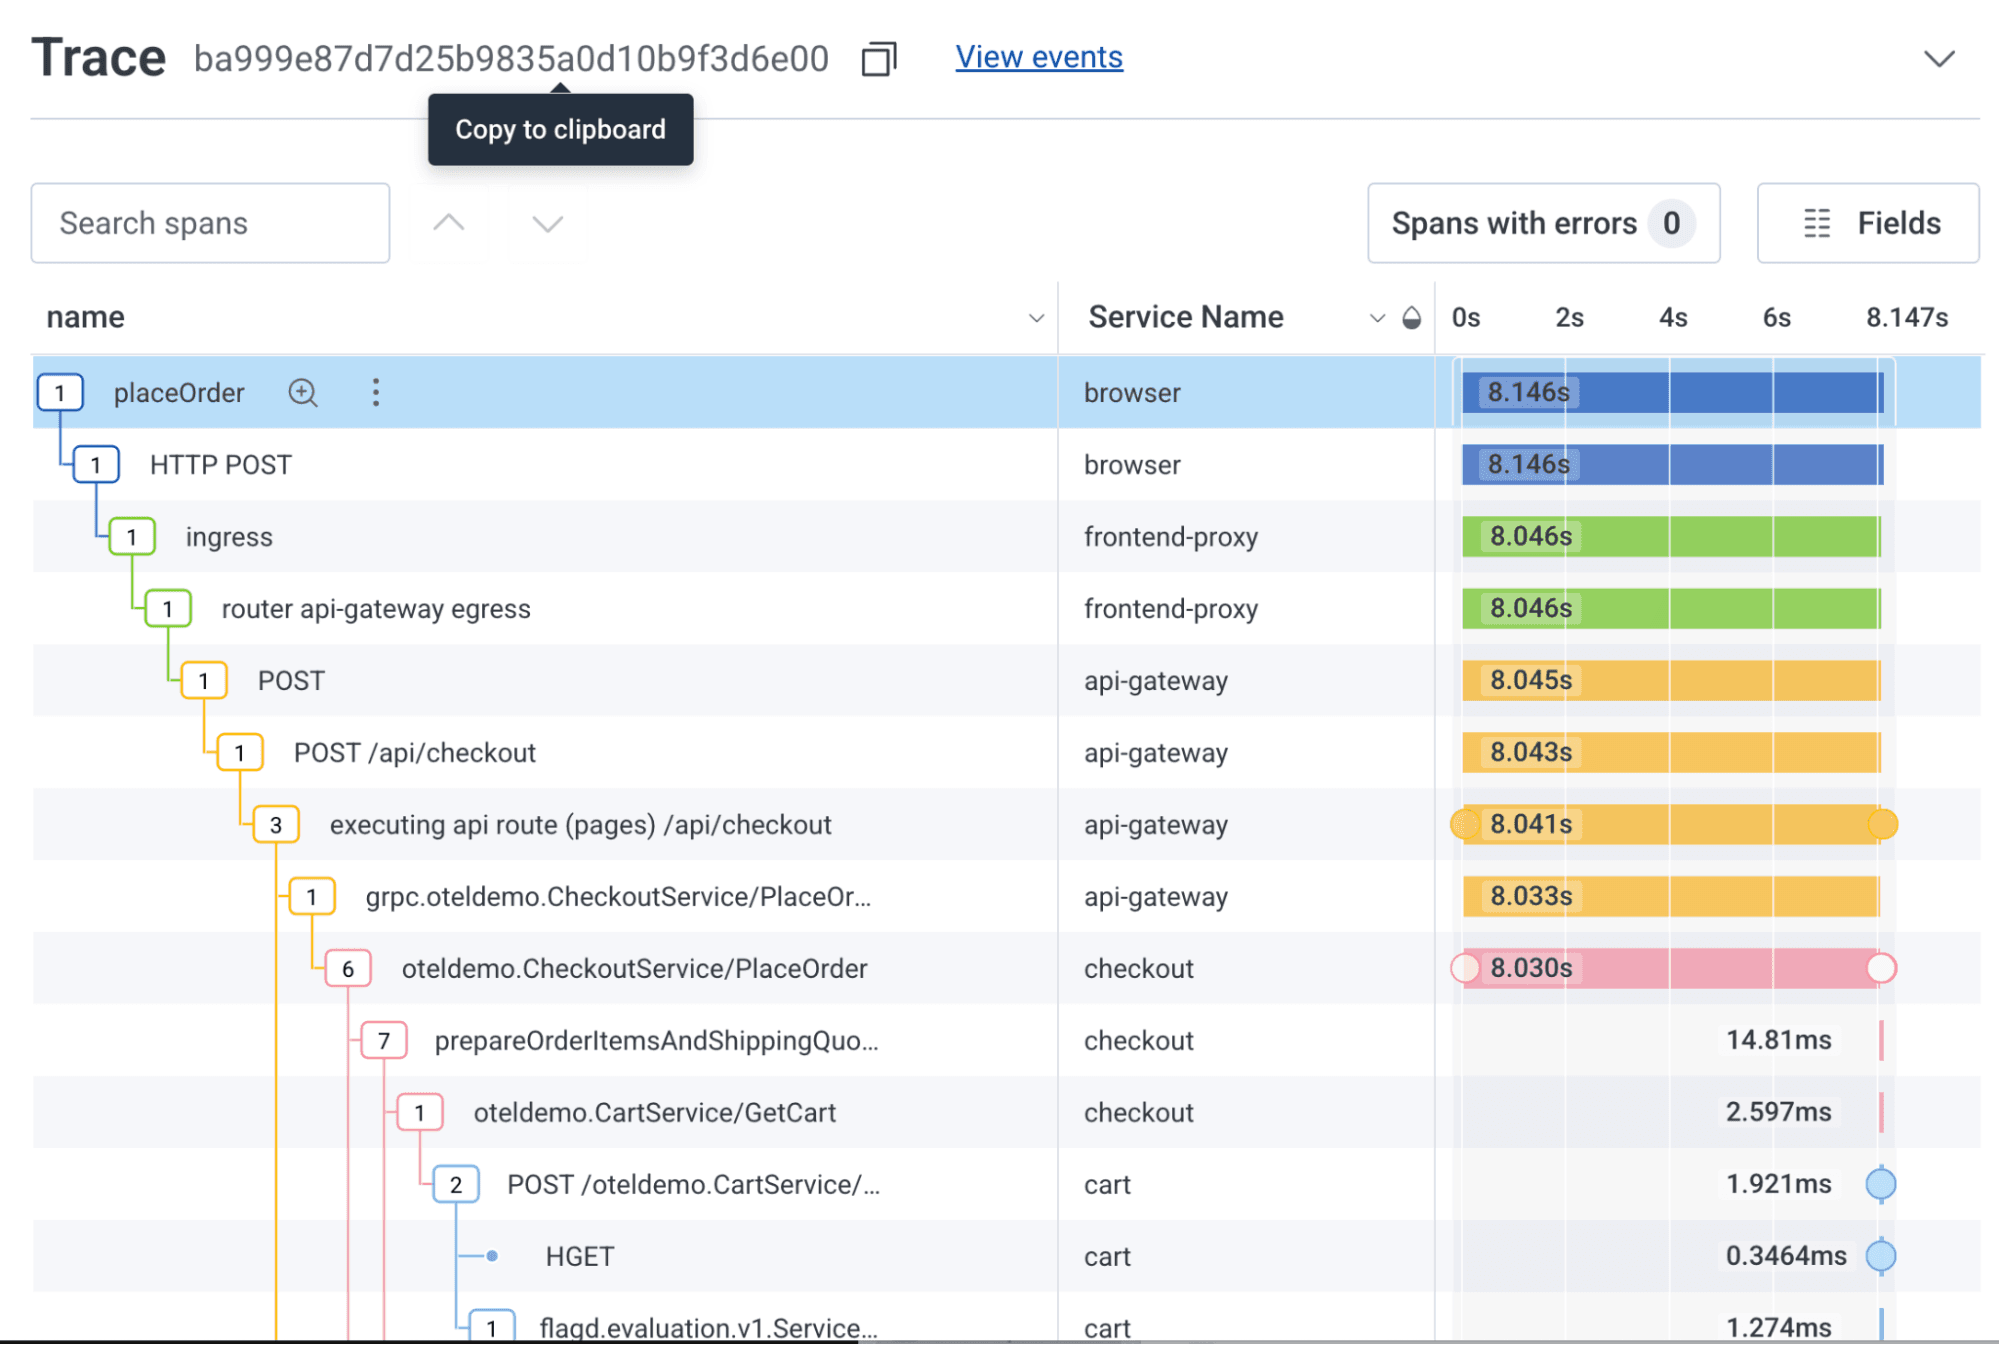
Core Web Vitals and end-to-end tracing
Honeycomb's OpenTelemetry-based SDK provides the ability to tie together browser network calls with backend operations in a unified, end-to-end trace. The trace contains details on the overall behavior of the application, starting from the browser, and can be used alongside these Core Web Vitals to determine what might be causing the poorly performing LCP, INP, CLS, or other measurement.
Final thoughts
The Core Web Vitals library provides indicators of browser performance, and Honeycomb has instrumented them using trace spans to include them in Honeycomb frontend telemetry data.
I like to think of Core Web Vitals as a trailing indicator that something's going wrong. You won't see end-to-end tracing details in a poor LCP score, but it should trigger you to query that user's session.id for traces that take a long time to complete. Dig in to your CSS design and look at the traces that feed the data that shifts your UI when you see a significant CLS score. And if you see slow INPs repeatedly from a type-ahead search, go look for the traces that feed your typeahead data. You can also use Canvas or the Honeycomb MCP to ask questions like, "I see some slow LCP scores for the /cart route. Can you tell me what traces are slowing my application down?"
By using these Core Web Vitals in conjunction with other signals, such as end-to-end traces, you'll better understand how your frontend applications behave in production, both in the browser and as part of a complete system.