Fast AI Feedback Loops with Honeycomb and OpenTelemetry
Observability is the visibility you need to get the job done. Sending telemetry to Honeycomb explains what your agents are actually doing. OpenTelemetry provides semantic conventions for generative AI systems, a spec that defines how agents, LLMs, MCPs, and tools are properly observed. The primary telemetry is defined as trace spans and other events with specific naming patterns, mostly starting with gen_ai.

By: Ken Rimple

How to Resolve the Productivity Paradox in AI-Assisted Coding
Join Ben Good (Google) and Austin Parker (Honeycomb) as they unpack the productivity paradox in AI-assisted Coding.
Watch Now
Are you writing agentic applications, but aren’t sure what the agents are doing? Finding out too late that you've blown the budget with super expensive models? Not sure where the agents are failing, and feeling a loss of control? Could they do better?
Observability is the visibility you need to get the job done. Sending telemetry to Honeycomb explains what your agents are actually doing.
OpenTelemetry provides semantic conventions for generative AI systems, a spec that defines how agents, LLMs, MCPs, and tools are properly observed. The primary telemetry is defined as trace spans and other events with specific naming patterns, mostly starting with gen_ai.
Telemetry gives you velocity
Agentic telemetry gives you real velocity: you make improvements faster, more precisely, and your job as the agent manager is a whole lot more fun.
With the proper telemetry enabled and sent to Honeycomb, you can:
- spot models that are costly yet don't do that much work, allowing you to downshift to something cheaper
- spot slow-running tool calls
- spot a runaway agent burning up tool calls in a vain attempt to get a real answer (refactor!)
- compare different model providers, prompts vs. outputs—pretty much anything you can add as an attribute will help you
- [bonus] use a model eval tool and add those spans to your traces later
Because this telemetry includes traces and logs, you can use it in SLOs, alerts, dashboards, and queries.
Instrumentation varies by provider
Some LLM providers send telemetry as log messages. Others send some or all of the telemetry in non-conforming spans and attributes. And sometimes the agents are being called via a prompt directly in the tool itself, which means the internal sub-agent operations are more difficult to access.
However, you do have some levers to pull to bend your agentic code to your will, and your coding agents can reference the APIs and capabilities of some of your agents to get some of that information relatively easily.
In this post, I'll use Pydantic AI as an example, as it is model agnostic, and sends telemetry to any OpenTelemetry destination including Honeycomb.
At this time, the platform's automatic instrumentation follows the Gen AI semantic conventions, version 1.37.0, but only partially covers baseline attributes and traces. To give you full visibility into token usage, failure detection, tool call debugging, and model identification, I'll show you how to enhance the telemetry.
The full repo for this example is available here.
Learn more about Honeycomb Intelligence
Connect with our experts today.
Bridging the gap in telemetry: an example
So, you've coded up a sample agent with Pydantic and you're ready to send agentic telemetry to Honeycomb. With codex, claude code, or any other coding agent, this job is easier.
You can tell your coding agent to cook up agentic telemetry using a prompt like this:
Please wire up telemetry for my agentic code, following the Semantic Conventions for Generative AI v1.40.0 - it's documented at https://opentelemetry.io/docs/specs/semconv/gen-ai/.

All Agentic spans should include (as a minimum):
- gen_ai.conversation.id
- gen_ai.agent.name
- gen_ai.operation.name

I'm using Pydantic AI, and OTel auto-instrumentation documentation
is found here: https://ai.pydantic.dev/logfire/#alternative-observability-backends.
Please externalize the configuration settings into an `.env` file, and make a sample as `.env.example`. Don't check in the `.env` file.

I am accessing Honeycomb for my telemetry, so use the production US Honeycomb endpoint https://api.honeycomb.io/v1/traces to send traces.This should be enough to configure automatic instrumentation from Pydantic.
Even better, before you begin your agent, make sure you include instrumentation instructions in CLAUDE.md, AGENT.md, or whatever context file you need the agent to see and use OpenTelemetry from the very beginning.
I'd also like to point you to our new Agent Skill plugin, a set of Claude Code and Cursor skills (also supported by Auggie). It contains an /otel-instrumentation skill that helps you with instrumentation tasks.
How does Pydantic instrument AI spans?
If you have a Python application wired to use Pydantic AI, you can follow their OpenTelemetry setup instructions. In that document, one method call enables the Pydantic AI agent instrumentation:
from pydantic_ai import Agent

# Later, in the instrumentation setup code...
Agent.instrument_all()
At the time of writing this blog, the version of telemetry sent by Pydantic AI follows the Gen AI specification, version 1.37.0, but not fully, since we’re going to add more details to the telemetry later in this post.
Using Honeycomb's trace view to review telemetry
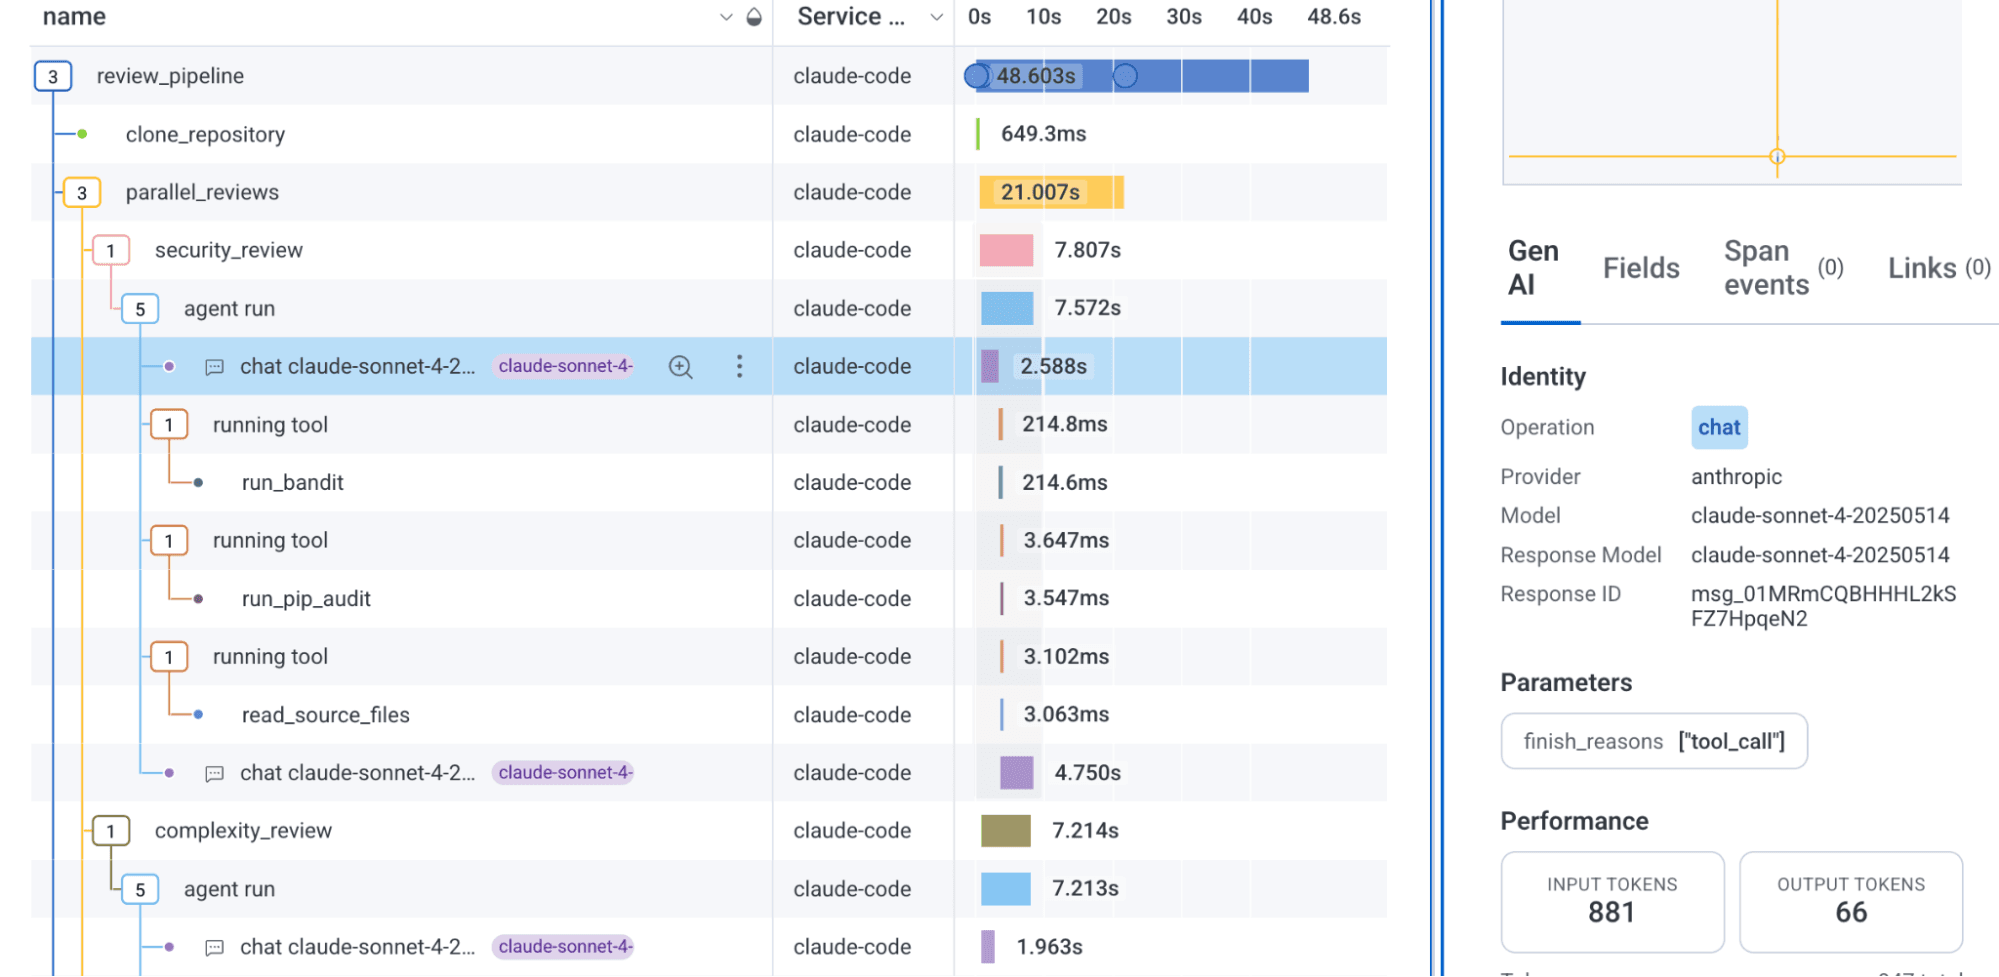
When you send telemetry following the full Gen AI specification, Honeycomb does two things. First, it decorates agentic spans with icons and tooltips to make it easier to spot them:
When you click on an agentic span, you'll be taken to a new Gen AI attributes view, which highlights the key LLM, Agent, MCP, Tool Call, and Model Evaluation span attributes:
If you need to view all of the raw span attribute names, the Attributes pane is still there. You can add anything in these attributes to your Honeycomb dashboards, alerts, etc.
Querying agentic telemetry
We can query agentic telemetry just like anything else in Honeycomb. Here’s an example looking at input and output token spend and span duration across many agents through their trace spans:
Heatmaps draw boxes representing spans in a particular time range (every two minutes in the example above). The height of the box represents the spend / duration, and the darkness of the box indicates how many spans fell within that timeframe.
All we're doing here is using Honeycomb with agentic telemetry!
Shaping telemetry
You'll find that there isn't a specific pre-defined shape to telemetry. For example, do you have a single trace for an entire agentic interaction, or one for each agent and sub-agent? Are your agent -> chat -> tool use spans nested, or are they flat?
The decision is up to you, or more specifically, up to your instrumentation. As we saw in the examples above, Pydantic nests chats and tool calls within agent invocations, to make it easier to see the execution paths.
Example uses
Over the past few weeks, I've used the Gen AI telemetry in a few very useful ways:
- I got a handle on slow agent calls, debugging a timeout exception when one agent called another that took more than five minutes to return. Exception attached to an agent calling span, addressed the timeout, problem fixed.
- I changed from using Claude Opus for one of my code review agents and found that Claude Sonnet was just fine. Likewise, I could just run my orchestration agent with Claude Haiku. Instant savings!
- I debugged several tool permissions issues by looking into the reason for their failures.
- I inappropriately added LLM evaluations to my LLM chats synchronously. Talk about wasting time and money (and causing, oh, I don't know, a five minute timeout). The trace itself showed my mistakes, and I quickly started scheduling them in another process.
- I use the messages section of the Gen AI panel all the time, digging into the quality of my agent requests, chats, and tool calls.
The best part of this is that we're in Honeycomb. So having Gen AI spans mixed in with other spans of your traces is both natural and useful. Here's an example of a chatbot agent making up part of an HTTP service that answers a customer question:
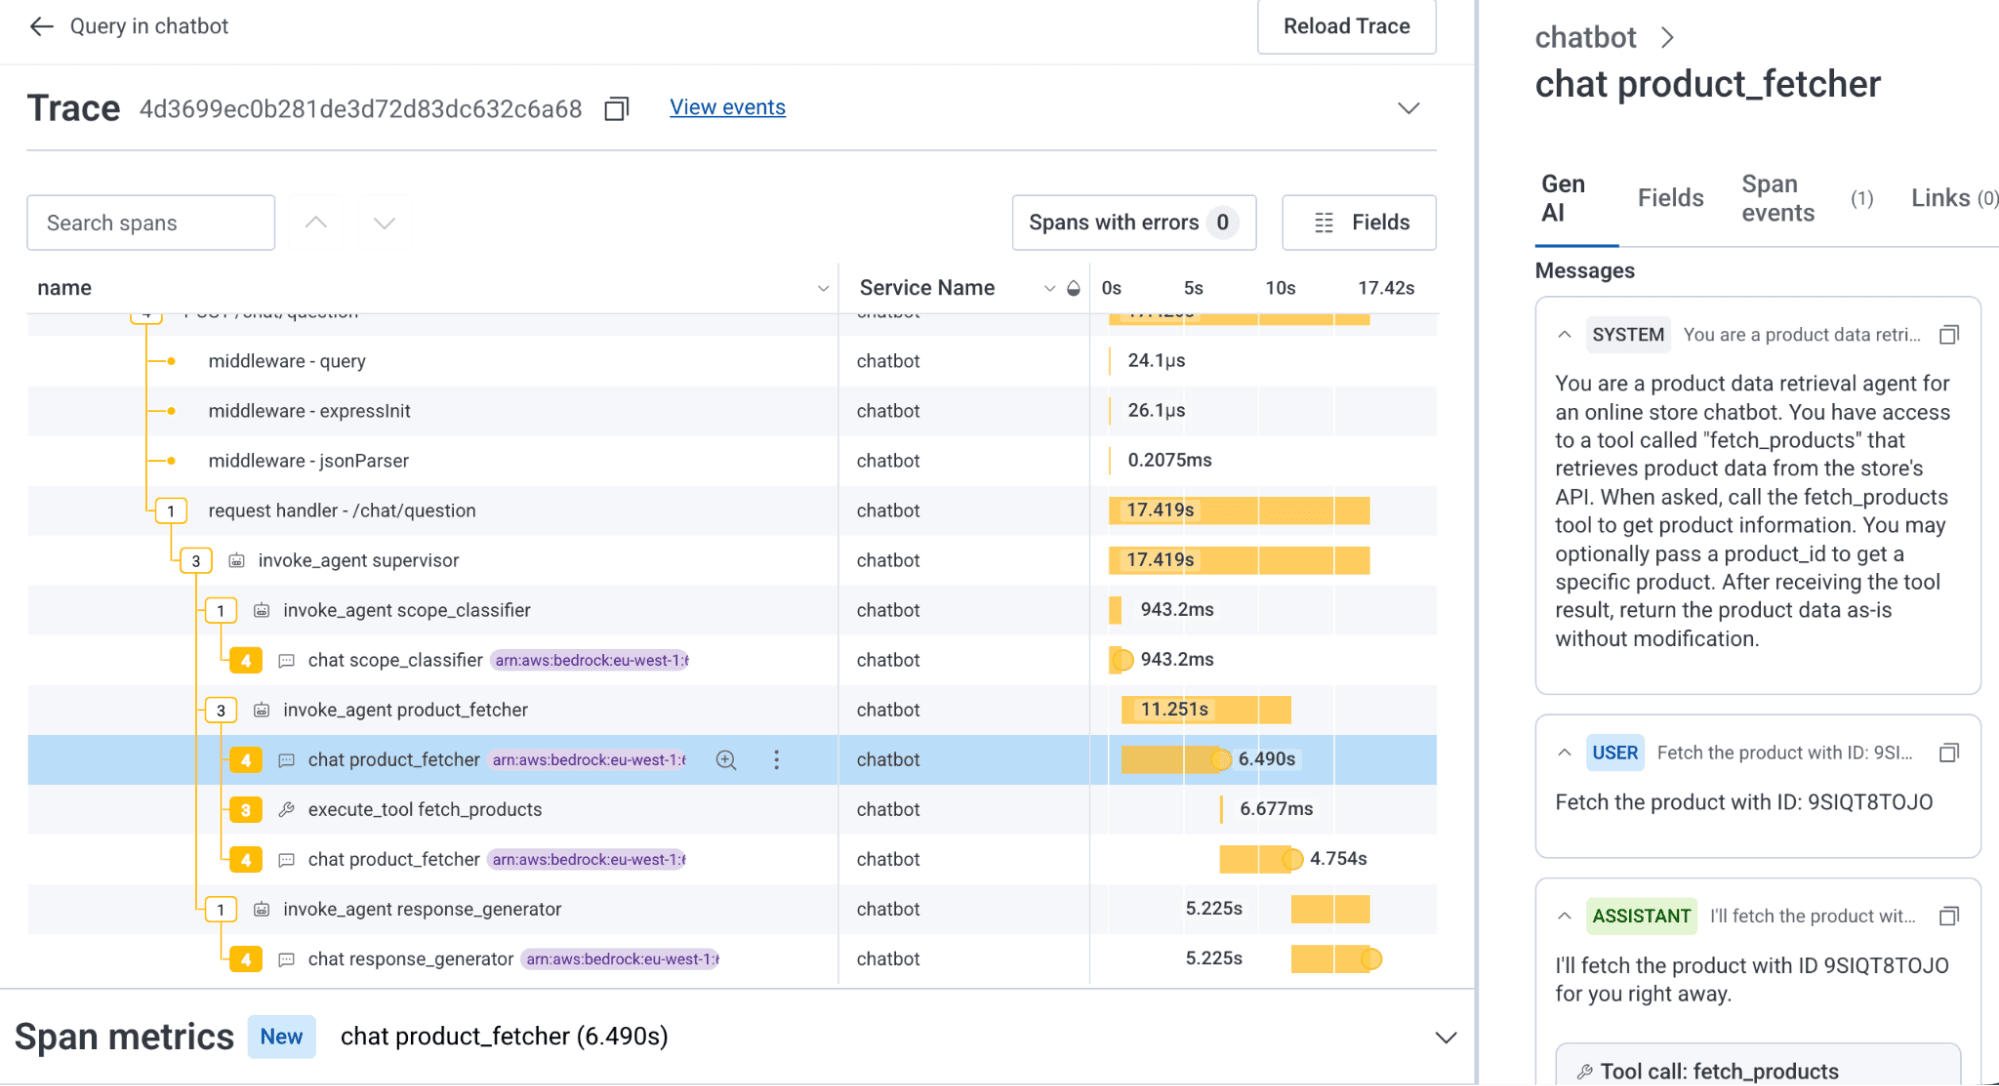
You can see from the trace above that our agentic spans are just new telemetry shapes. In this trace, we see that the time taken to fetch a product is unusually long—over six seconds for what should just be a simple tool call to an API endpoint.
We can cut that time in half just by giving the agent a simple tool to fetch the data.
What if I don't see the Gen AI panel for my span?
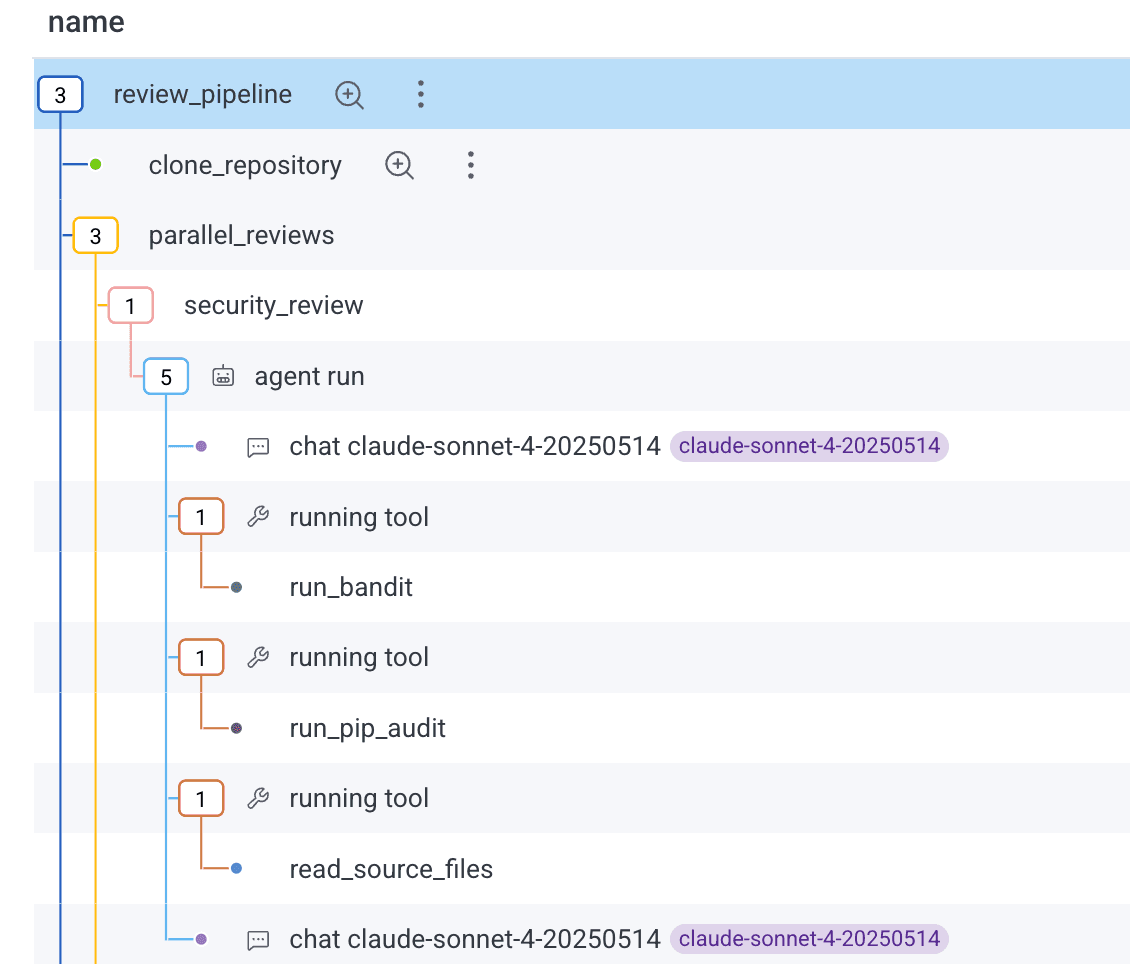
In the screenshot below, only the chat spans show an icon, but not an agent invocation or a tool call span. Clicking on the span just shows the standard fields list. Why?
If the span contains agentic telemetry with the key attribute gen_ai.operation.name, an icon will appear to the left of the span name, and the Gen AI panel will appear on the right-hand side with the selected Gen AI trace span, which will show the specific agentic span attributes for that type of span.
If your instrumentation is not sending gen_ai.operation.name, the Gen AI panel won't appear and the icon will not be visible.
You should enhance the telemetry and the attribute for operations where it isn't specified. These include:
- create_agent and invoke_agent when an agent is created and then called. The other attributes also includes an array of
gen_ai.input.messagesandgen_ai.output.messages. - chat when a chat is completed. There are a number of variants depending on whether content is captured or not, or whether there is a multimodal set of chat input or outputs (like images, etc).
- execute_tool when an agent executes an external tool. It records the type of tool, arguments, and the result.
You can find a more exhaustive list in the conventions specification.
You can see the auto-instrumented attributes in the standard attributes pane for the other LLM and agent spans; just search for gen_ai. However, because Pydantic currently sends the gen_ai.operation.name attribute only for chat (and most recently, invoke_agent) spans, you don't see the panel for execute_tool spans.
Enhancing telemetry for better agentic visibility
There are a few techniques you can use when your API instrumentation sends less complete, differently-named, or less detailed auto-instrumentation data. You could create an OpenTelemetry span processor and adjust the instrumentation in your code.
Renaming / transforming existing span attributes
For attributes with the right information but the wrong name or format, you can rename or transform them.
Here’s an example OpenTelemetry Collector transform processor that adds the gen_ai.operation.name attribute based on the span name attribute provided by the library instrumentation:
#

processors:
  transform:
    trace_statements:
      - context: span
        statements:
          # Each rule fires only if no operation name has been set yet
          # (simulates the `break` in the Python loop)
          - set(attributes["gen_ai.operation.name"], "chat")
            where IsMatch(name, "^openai\\.chat")
            and not IsSet(attributes["gen_ai.operation.name"])

          - set(attributes["gen_ai.operation.name"], "text_completion")
            where IsMatch(name, "^openai\\.completion")
            and not IsSet(attributes["gen_ai.operation.name"])

          - set(attributes["gen_ai.operation.name"], "embeddings")
            where IsMatch(name, "^openai\\.embeddings")
            and not IsSet(attributes["gen_ai.operation.name"])

          - set(attributes["gen_ai.operation.name"], "chat")
            where IsMatch(name, "^anthropic\\.messages")
            and not IsSet(attributes["gen_ai.operation.name"])

          - set(attributes["gen_ai.operation.name"], "execute_tool")
            where IsMatch(name, "^tool\\.")
            and not IsSet(attributes["gen_ai.operation.name"])
Renaming and adding telemetry attributes
The Gen AI specification moves fast, and vendors are still catching up. As of this writing, Pydantic AI's auto instrumentation doesn't fully provide all of the attributes for version 1.40.0, the version Honeycomb's Gen AI view is built against, which creates two challenges: missing attributes and non-conforming attributes.
Adding the attributes to a span
If your agentic telemetry span is missing a required field, such as gen_ai.operation.name, gen_ai.agent.name, or gen_ai.agent.id (or others), you can add it. In the v1.77.0 version of Pydantic AI, tool executions don't include all of the required attributes. We can provide them either when the span is created, or later, after the execution of the tool and before the span ends.
There is a catch, however. Since the attribute definitions are still marked as experimental, the OpenTelemetry project suggests that you don't use them from the project directly. One suggestion on how to reference them suggests that you copy attributes into your own source file, essentially freezing them so any changes to the semantic conventions library don't affect your code without warning. You can read about this and other approaches in this note on stability and versioning. There is a specific example available for JavaScript/TypeScript.
This example shows the source of those attributes coming from our own package:
import {
 ATTR_GEN_AI_AGENT_ID,
 ATTR_GEN_AI_AGENT_NAME,
 ATTR_GEN_AI_CONVERSATION_ID,
 ATTR_GEN_AI_OPERATION_NAME,
 ATTR_GEN_AI_PROVIDER_NAME,
 ATTR_GEN_AI_TOOL_CALL_ARGUMENTS,
 ATTR_GEN_AI_TOOL_CALL_ID,
 ATTR_GEN_AI_TOOL_NAME,
 GEN_AI_OPERATION_NAME_VALUE_EXECUTE_TOOL,
} from "./semconv-gen-ai-frozen-names";


...


# creating the span
const toolSpan = tracer.startSpan(
 `${GEN_AI_OPERATION_NAME_VALUE_EXECUTE_TOOL} ${toolCall.name}`,
 {
   attributes: {
     ...(issueAttrs as Record<string, string | number>),
     [ATTR_GEN_AI_PROVIDER_NAME]: GEN_AI_PROVIDER_NAME_VALUE_ANTHROPIC,
     [ATTR_GEN_AI_OPERATION_NAME]: GEN_AI_OPERATION_NAME_VALUE_EXECUTE_TOOL,
     [ATTR_GEN_AI_AGENT_ID]: agentName,
     [ATTR_GEN_AI_AGENT_NAME]: agentName,
     [ATTR_GEN_AI_TOOL_NAME]: toolCall.name,
     [ATTR_GEN_AI_TOOL_CALL_ID]: toolCall.id,
     [ATTR_GEN_AI_TOOL_CALL_ARGUMENTS]: JSON.stringify(toolCall.input),
     [CustomAttributes.TURN_NUMBER]: turnNumber,
     [ATTR_SERVICE_NAME]: agentServiceName,
   },
 },
 toolCtx
);


...


# before ending the span... get first 4K of a large result
toolSpan.setAttribute(ATTR_GEN_AI_TOOL_CALL_RESULT, resultText.slice(0, 4096));You should periodically review your frozen experimental attributes and update them when they change, switching to the semantic conventions library once they become stable.
Recording errors on the agentic spans is very useful:
try {
    ... execute tool...

} catch (e) {
    const error = e as Error;
    resultText = `Tool error: ${error.message}`;
    toolSpan.setAttribute(ATTR_ERROR_TYPE, error.name ?? "Error");
    toolSpan.setAttribute(ATTR_EXCEPTION_TYPE, error.name ?? "Error");
    toolSpan.setAttribute(ATTR_EXCEPTION_MESSAGE, error.message);
    toolSpan.setAttribute(ATTR_EXCEPTION_STACKTRACE, error.stack ?? "");
    toolSpan.setStatus({ code: SpanStatusCode.ERROR, message: error.message });
    toolSpan.recordException({
        code: SpanStatusCode.ERROR,
        message: error.message,
        stack: error.stack, name: error.name });
} finally {
  toolSpan,.end()
}These examples are a reminder that built-in telemetry will get you started, but it won't always add all of the subtle details and edge cases. This depends directly on the agentic platform's support of the Gen AI specification and your required business context.
Renaming / transforming existing span attributes
For attributes with the right information but the wrong name, you can rename them with a transform processor, too:
processors:
  transform:
    trace_statements:
      - context: span
        statements:
          - >-
            set(attributes["gen_ai.tool.call.result"],
            attributes["tool_response"]) where
            attributes["tool_response"] != nil
          - >-
            delete_key(attributes, "tool_response") where
            attributes["tool_response"] != nil
          - >-
            set(attributes["gen_ai.tool.call.arguments"],
            attributes["tool_arguments"]) where
            attributes["tool_arguments"] != nil
          - >-
            delete_key(attributes, "tool_arguments") where
            attributes["tool_arguments"] != nil
          - >-
            set(attributes["gen_ai.agent.name"],
            attributes["agent_name"]) where
            attributes["agent_name"] != nil
          - >-
            delete_key(attributes, "agent_name") where
attributes["agent_name"] != nilIf the attribute is in the wrong physical format, like a single array instead of two, you might need to code up a specific OpenTelemetry processor.
Creating a Collector processor is more involved, so here’s a GIST to illustrate the technique.
Avoid using SpanProcessors
The issue with transforming telemetry using a SpanProcessor is that you'd have to install it for each program that runs with Pydantic AI, and if the API telemetry improves, you'll need to update it for each agent.
Don't be afraid to codify what you want in a spec file with requirements and tests, and let your coding agent help you write the code. Just remember to test, commit and / or rollback and adjust / resend the spec atomically!
Be aware of personally identifiable information (PII)
Take care to follow laws and guidelines about exposing personally identifiable information in your telemetry. If you need to redact or omit telemetry for prompts, or agent / chat inputs and outputs, you can use various approaches in the Handling Sensitive Data section of the OpenTelemetry documentation.
Wrap-up
I hope you enjoy adding Gen AI telemetry to your Honeycomb traces as much as I do. Make sure to read up on the semantic conventions for generative AI systems specification, and check your LLM and agent provider's adherence to the specification. Claude Code, Codex, and others can do a good job in getting many of them to send the appropriate telemetry, so give it a try!